IBHE FIRST LOOK – FALL ENROLLMENT 2021-2022
Highlights
Illinois beat national trends in Fall 2021 enrollment
Fall enrollment at Illinois public universities increased by 1.2% from last fall.
Undergraduate enrollment at Illinois public universities was down by -0.9%, which equates to 1,218 fewer undergraduates year over year. However, nationally, public university undergraduate enrollment declined -2.5% as reported by the National Student Clearinghouse Research Center ¹
Graduate and professional enrollment at Illinois public universities increased by a robust 6.4%, equating to an additional 3,380 students. This increase was over 2 and a half percentage points better than the national 3.9% change in graduate enrollment for all public universities.
Freshmen enrollment at Illinois public universities increased by 7.8% year over year. This too bucked national trends which indicated a -2.7% decline in freshmen at all public universities
African American undergraduate enrollment was down -2.0%, which was better than the -5.0% national decrease. In Illinois, enrollment of African American freshmen increased by 7.0%. Illinois public universities grew African American graduate and professional enrollments by 1.0%, higher than the 0.2% growth that was reported nationally.
Latinx undergraduate enrollment, while relatively flat at +0.5%, was better than the national -0.8% decline. At the graduate/professional level, Latinx enrollment increased 7.1%, which was higher than the 6.3% year over year growth nationally at public universities.
Overview
IBHE has continued to collaborate with the Illinois public universities to provide an early look at fall enrollment. With its strong focus on equity as described in the new higher education strategic plan, A Thriving Illinois: Higher Education Paths to Equity, Sustainability, and Growth, IBHE has added enrollment data by race/ethnicity, as well as on more nuanced enrollment types, like dual credit and new undergraduate transfers. The following information on Illinois public universities complements the IBHE Preliminary Fall Enrollment Report on all degree-granting institutions and the IBHE report on enrollment and migration patterns of recent Illinois high school graduates.
For the first time, year-over-year retention rates among the previous fall’s freshmen are included in this report.
¹ For all of the national comparions, we used the following: National Student Clearinghouse Research Center. (November, 2021). COVID 19- Stay Informed with the Latest Enrollment Information. https://nscresearchcenter.org/stay-informed/
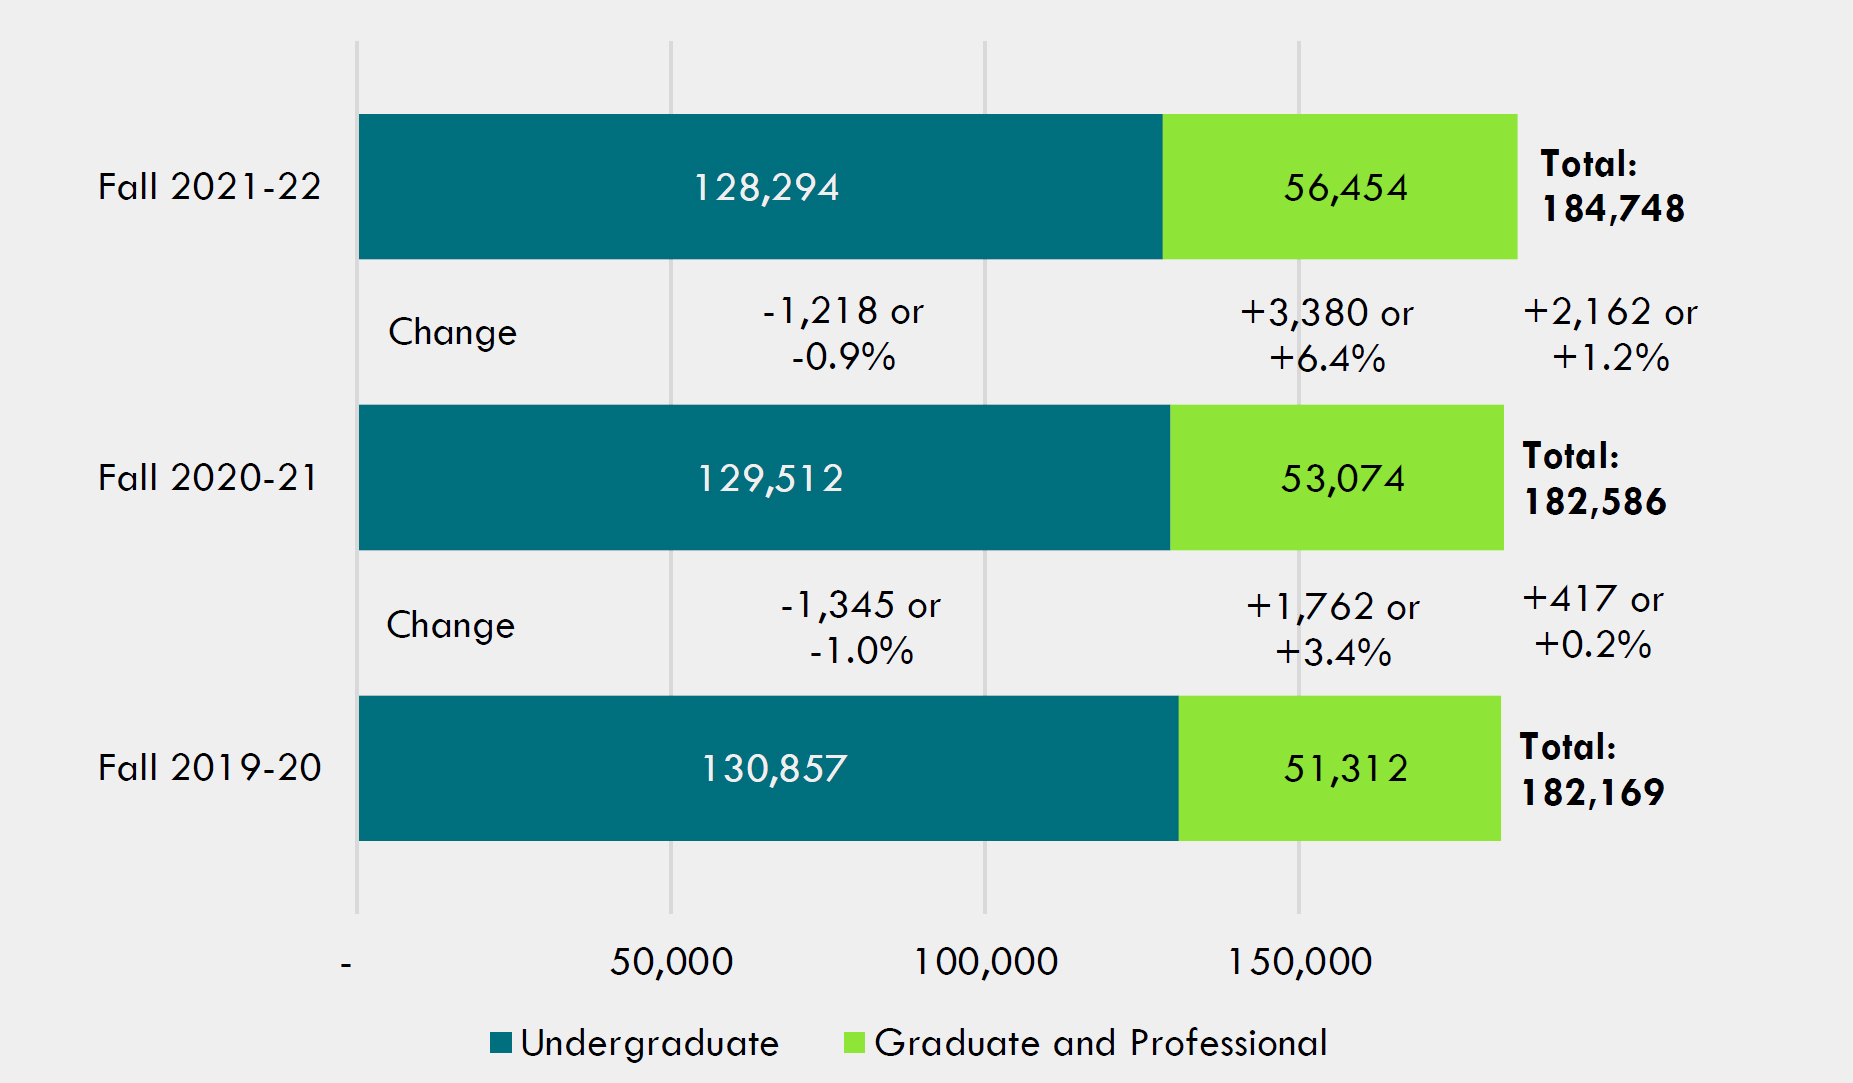
As shown in Figure 1, in fall of 2021, there was a 1.2% increase in total enrollment relative to fall of 2020- 21, equating to over 2,100 additional Illinois public university students. The pattern was similar to fall 2020 in which undergraduate enrollment was slightly down, but graduate and professional enrollment increased from the prior year.
Figure 1: Illinois Public University Headcount Enrollments
from Fall of Academic Year 2019-20 to 2021-22
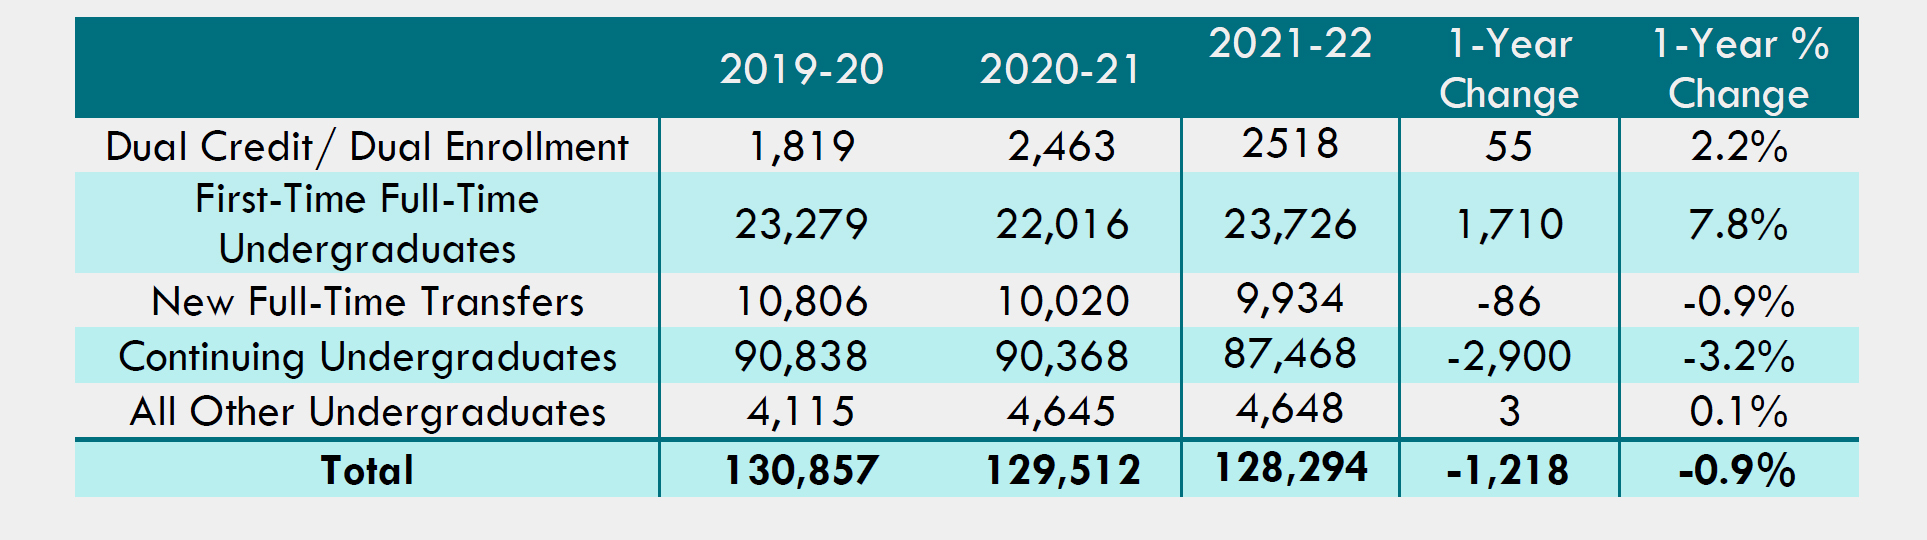
Undergraduate Enrollment. As shown in Table 1, overall undergraduate enrollment was down by -0.9%. With less than a 1% decline, Illinois performed better than the nation, where public university undergraduate enrollment declined by 2.5%.²
Table 1: Undergraduate Enrollment Type for Illinois Public Universities (Headcount)
Graduate and professional enrollment. As shown in Figure 1, graduate and professional enrollment at Illinois public universities increased by nearly 3,400 students, a robust 6.4% year-over-year increase. This exceeded the 3.9% growth in graduate enrollment reported nationally for all public universities.
As undergraduate enrollments comprise a much larger share of overall enrollments at Illinois public universities (slightly less than 70%), total enrollments were up by 2,162 or 1.2% relative to fall of AY2020-21. This resulted in Illinois public universities experiencing overall enrollment growth over both the previous two years.
²National Student Clearinghouse Research Center (November 2020). Stay Informed Series: Fall 2020 Enrollment (As of Oct 22). Herndon, Virginia. Retrieved from:https://nscresearchcenter.org/stay-informed/
Institutional Highlights and Detailed Enrollment
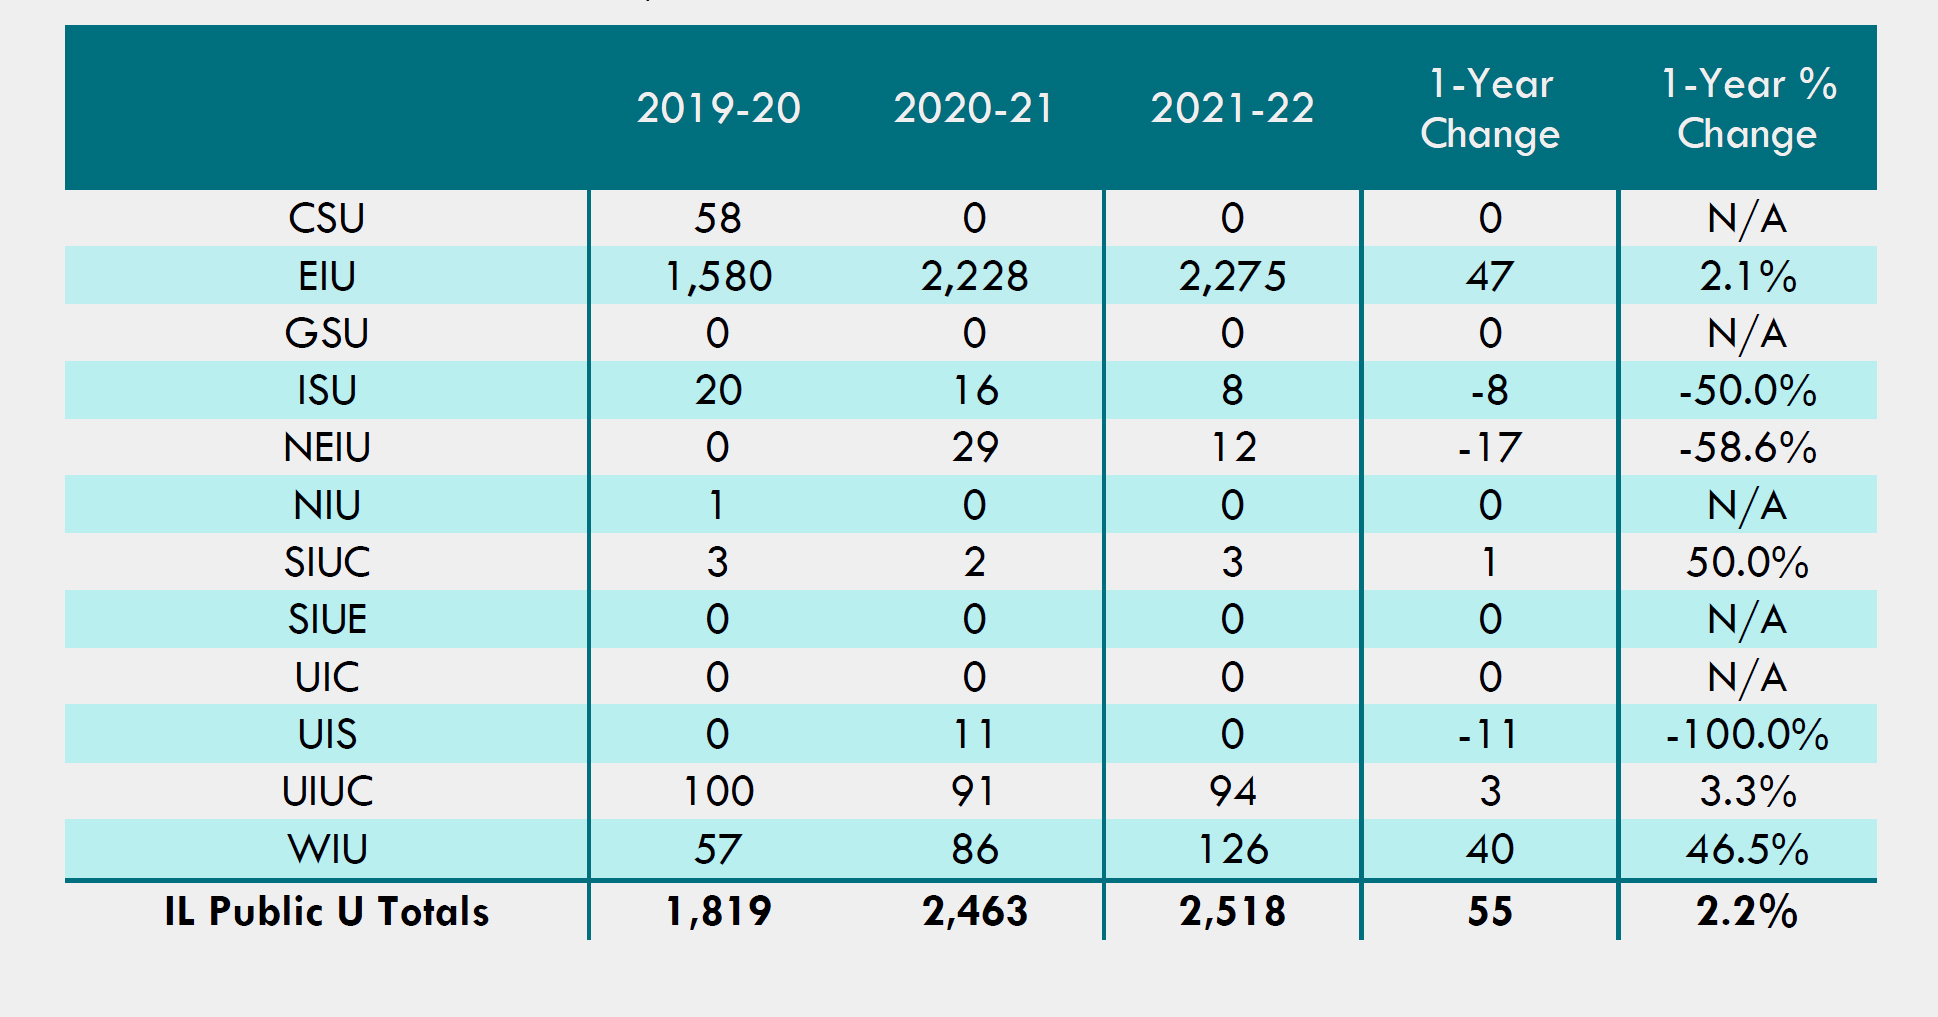
Dual Credit/Dual Enrollment. As shown in Table 2, dual credit enrollments were up by 2.2% (55), driven by modest year over year growth at Eastern Illinois University (EIU) and large proportional growth at WIU (46.5%). EIU still accounts for over 90% of the dual credit enrollments among the Illinois public universities (2,275 of the 2,518 reported headcount enrollments). In the previous year, EIU’s growth in dual credit enrollment helped to mitigate some of the overall undergraduate enrollment declines for the Illinois public universities. However, this year the change in undergraduate enrollment was almost identical (-0.9%), but without the large increase in dual credit enrollments.
Table 2: Dual Credit/Dual Enrollment at Illinois Public Universities (Headcount)
Full-Time Undergraduates.
As shown in Table 3, compared to the fall semester of last year, 7 out of the 12 public universities experienced growth in the number of first-time full-time undergraduates or incoming freshmen. UIUC had the largest year-over-year growth in the number of freshmen at 799 (+10.7%). UIC had the second largest number of additional freshmen (+567) a growth of +16.4%. SIUE also experienced a large increase in freshmen enrollment (+427) and at 29.3%, had the highest percentage growth relative to last year. Three institutions experienced double digit percentage declines in new freshmen.
Table 3: First-Time Full-Time Undergraduates (Freshmen) at Illinois Public Universities (Headcount)
-Illinois-Public-Universities-(Headcount).jpg)
New Full-Time Transfer Students.
As shown in Table 4, new full-time transfer enrollments were down by -0.9% compared to last year which equated to close to 90 fewer new transfers students across all of the Illinois public universities. Seven of the public universities experienced a year-over-year decline in the number of new transfer students, while the remainder experienced growth. Contrary to last year’s patterns, ISU had the greatest number of additional transfer students this year as well as the highest growth rate among IL public universities (+8.9%). CSU (-17.7%), UIS (-12.9%), SIUE (-11.2%), and NEIU (-10.3%) all experienced double digit declines in the number of new transfer students relative to fall 2020-21.
Table 4: New Full-Time Transfer Students at Illinois Public Universities (Headcount)
.jpg)
Continuing Undergraduate Students. As shown in Table 5, there were 2,900 fewer continuing undergraduate students comparing 2020-21 to 2021-22, a decline of -3.2%. This was higher relative to the decline from the previous year (comparing 2019-20 to 2020-21) of -0.5% and 431 fewer continuing undergraduate students.
All Illinois public universities except UIUC experienced a decline in the number of continuing undergraduate students. The proportional declines in continuing undergraduates ranged from -0.5% at EIU on the low end to -11.6% at NEIU on the high end. NIU experienced the largest decline in the number of continuing undergraduate students at -669, followed by ISU at -437 and NEIU at -434.
Table 5: Continuing Undergraduate Students at Illinois Public Universities (Headcount)
.jpg)
Graduate and Undergraduate Enrollment Summary. As shown in Table 6, total enrollment increased by 1.2%, beating the national pattern, which showed a decrease of -2.6% enrollment across all institutons.
Similarly, Illinois beat national trends when examining undergraduate enrollments, with a 0.9% decrease, while nationally, undergraduate enrollment at public universities dropped -2.5%. Three of the Illinois public universities experienced year-over-year growth: UIUC (3.3%), UIC (1.6%), and SIUE (0.3%), while institutions that serve largely students of color, NEIU (-11.7%), CSU (-11.2%), and GSU (-10.3%), experienced the largest overall undergraduate enrollment declines.
At the graduate level, enrollment in Illinois increased by 6.4%, while nationally, public universities saw a an increase of only 3.9%. Seven of the Illinois public universities experienced growth in graduate/professional enrollments compared to fall of AY 2020-21. WIU had the largest percent increase (26.0% and 425 additional graduate students), followed by UIUC (14.9% and 2,832 additional students), SIUE (4.3% and 125 additional students), and GSU (3.6% and 581 additional students).
Table 6: Enrollments and Year to Year Change (Headcount)
.jpg)
Enrollment Patterns by Race/Ethnicity
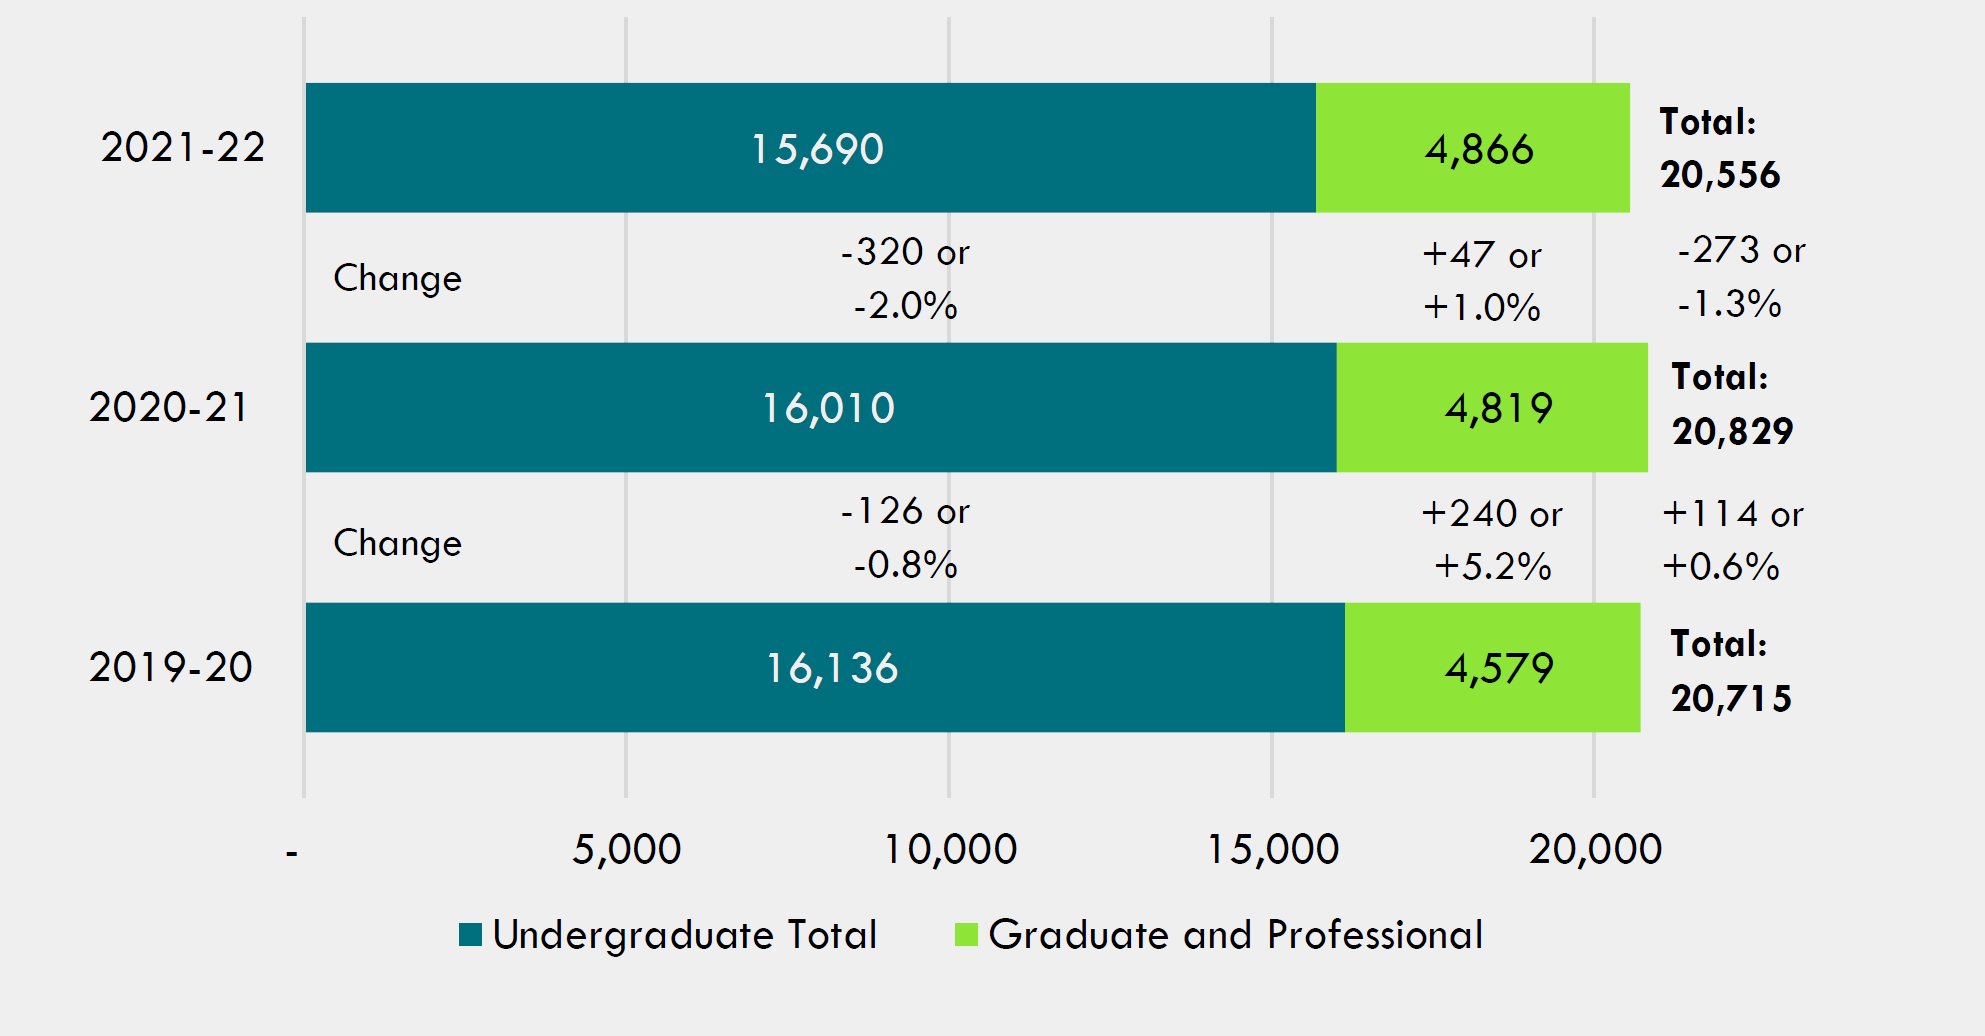
African American Enrollments. As shown in Figure 2, overall African American enrollment at Illinois public universities was down -1.3% to 20,556 in 2021-22 and fell slightly below fall semester 2019-20 enrollment of 20,715. Undergraduate enrollments were down in fall of 2021-22 by -2.0% to 15,690. However, this was much better than the -5.0% decline in African American undergraduate enrollments that was reported nationally for all public universities. At Illinois public universities graduate and professional enrollments grew by 1.0% to 4,866, which was slightly higher than the 0.2% growth that was reported nationally.
Figure 2: Headcount Enrollment of African American Students at Illinois Public Universities
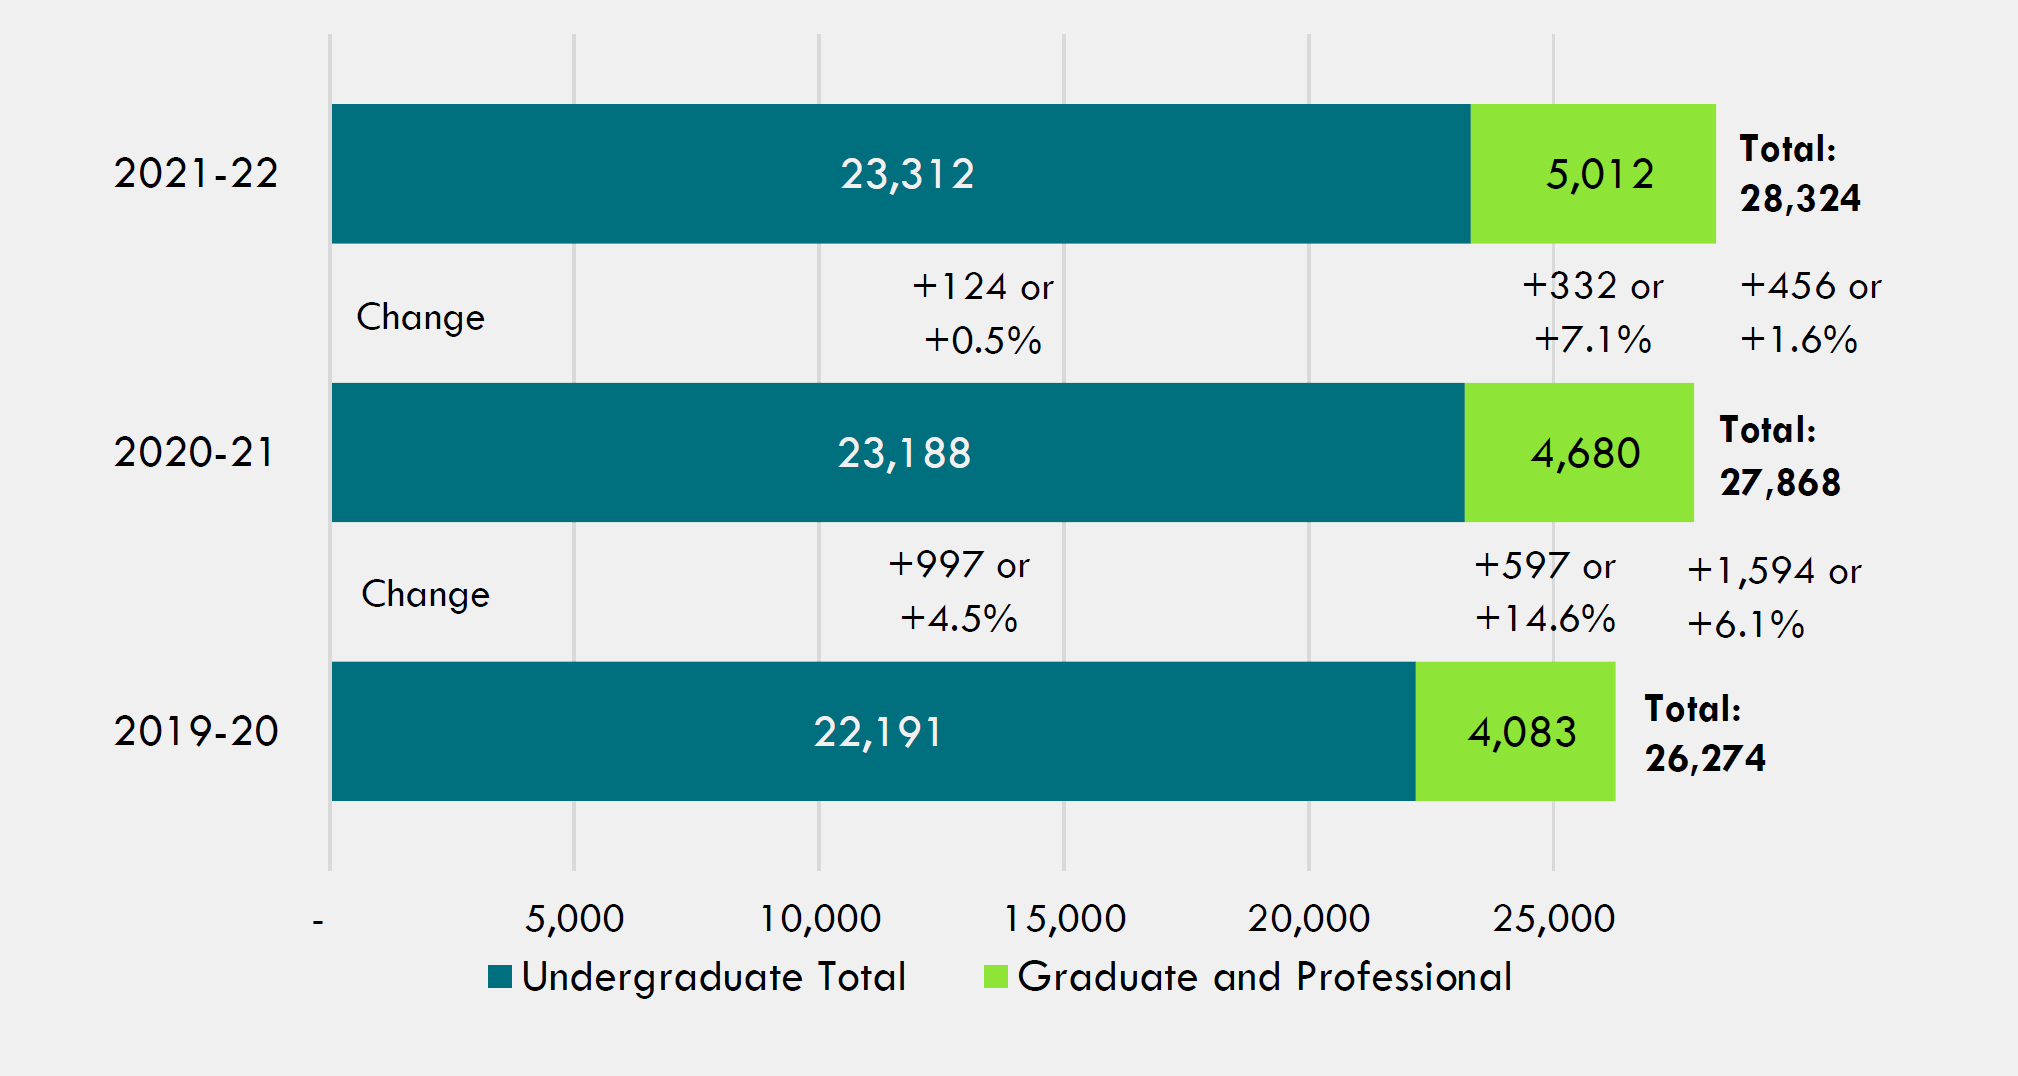
Latinx Enrollments. As shown in Figure 3, total Latinx enrollment at Illinois public universities increased by 1.6%, or nearly 450 students from fall of AY2020-21. However, the enrollment growth was not as large as the 6.1% increase from AY2019-20 to AY2020-21. Latinx undergraduate enrollment was relatively flat (+0.5%). This was slightly better than the -0.8% decline in Latinx undergraduate enrollment that was reported nationally for all public universities. At the graduate/professional level, Latinx students experienced an increase of 7.1% or 332 students at Illinois public universities (4,680 to 5,012), which was still fairly robust, but not as large as what occurred the year before. This too was slightly higher than the 6.3% year over year growth in Latinx graduate and professional enrollments nationally at all public universities.
Figure 3: Headcount Enrollment of Latinx Students at Illinois Public Universities
White Enrollments. As shown in Figure 4, overall, there were nearly 2,500 fewer white students enrolled at Illinois public universities, an enrollment loss of -2.8%. Undergraduate enrollment of white students was down 2,310 or -3.7%. This decline was better than the -4.5% annual change in white undergraduate enrollment that occurred nationally. Since the Fall of 2019-20, over 4,000 fewer white undergraduates enrolled at Illinois public universities. The year-over-year change in graduate enrollment at Illinois public universities was down -0.6% and this was slightly worse than the national year over year change of +0.3%.
Figure 4: Headcount Enrollment of White Students at Illinois Public Universities

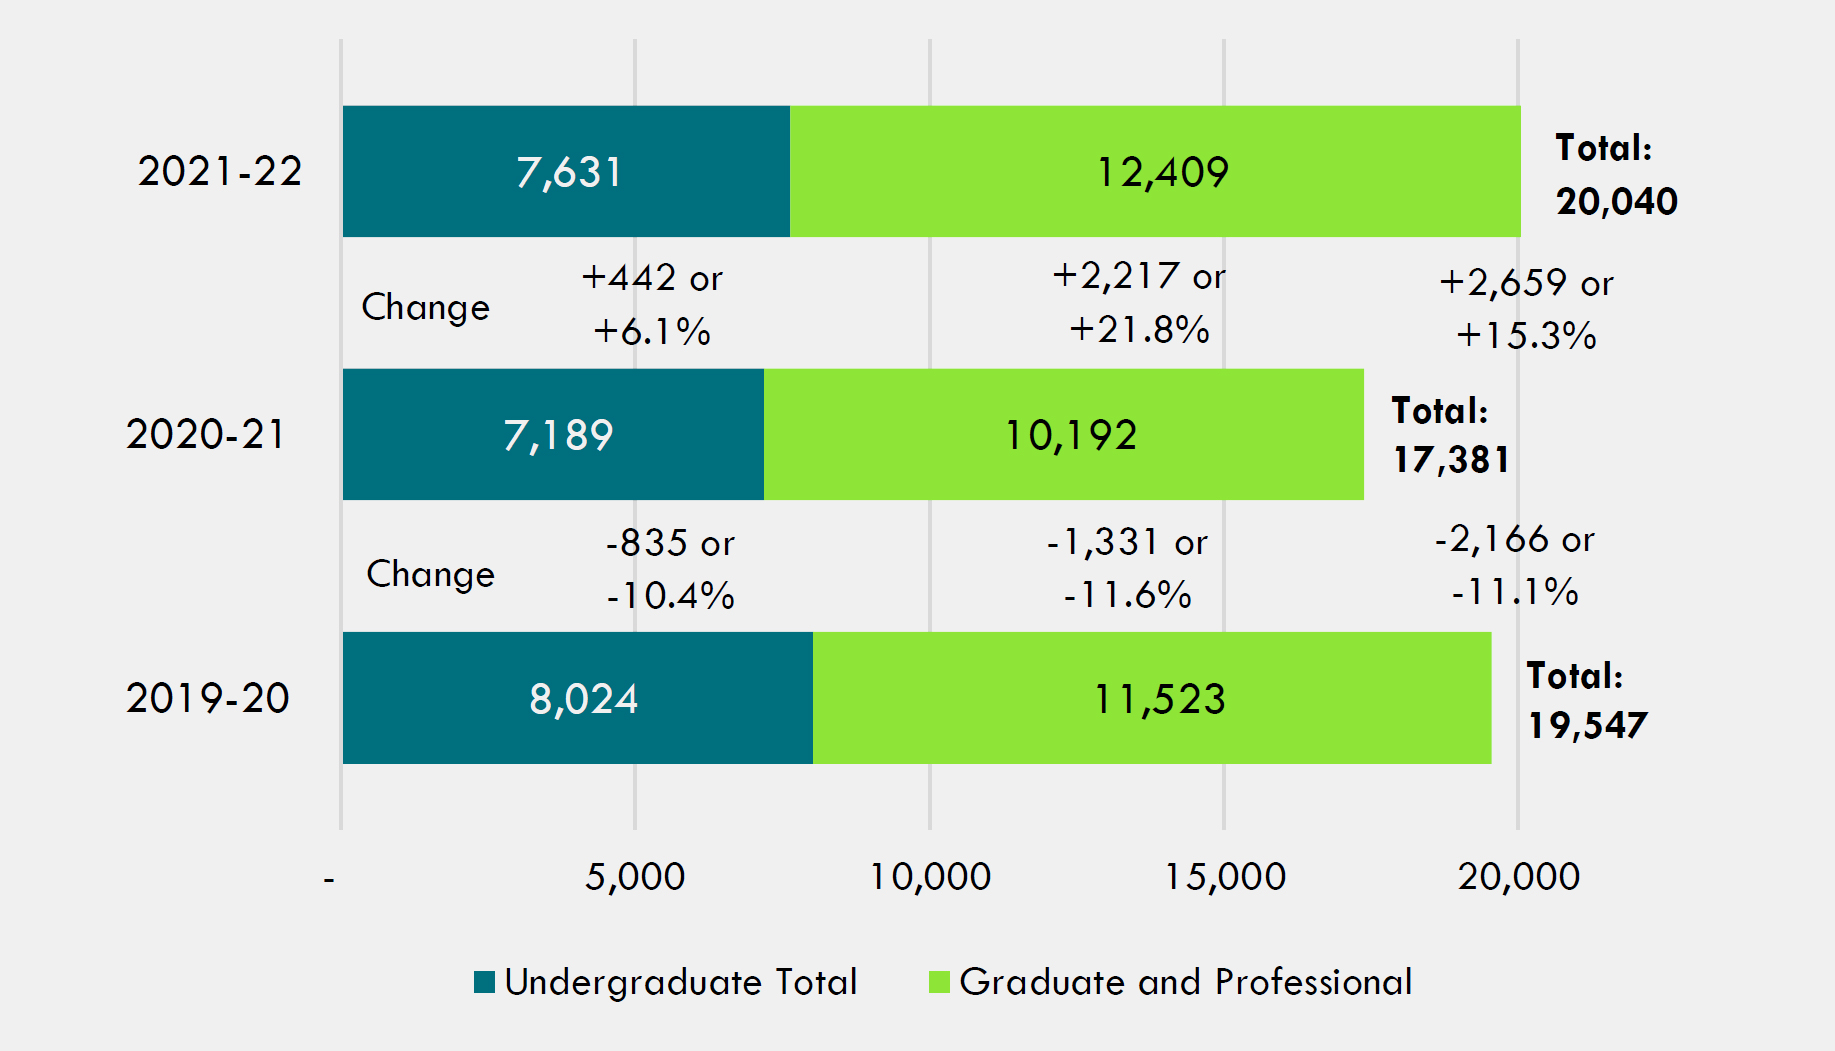
International Student Enrollments. As shown in Figure 5, after experiencing large enrollment declines among international students in 2020-21 (-11.1%), overall enrollment of international students at Illinois public universities bounced back in fall of 2021-22 to above 20,000 and is now well above 2019-20 levels. The overall enrollment increases for international students equated to a robust 15.3% year-over year growth, which was significantly higher than the -7.0% year over year decline in international enrollments that was reported nationally. Illinois public universities experienced a robust increase in graduate and professional enrollments among international students (+21.8) increasing proportionally more than undergraduate enrollments (+6.1%). This too was higher than the 12.7% year over year change for international students reported nationally across all public universities.
Figure 5: Headcount Enrollment of International Students at Illinois Public Universities
Fall to Fall Retention by Race/Ethnicity. As shown in Figure 6, more than eight out of every ten (81.7%) new freshmen at Illinois public universities who were enrolled in the fall of AY 2020-21 were still enrolled in the fall semester of AY2021-22. However, gaps emerged when retention rates were disaggregated by race/ethnicity. A retention gap of nearly 20 percentage points was evident between African American undergraduates (65.5%) and their white peers (85.6%). The retention gap between Latinx undergraduates and their white counterparts was smaller at around seven percentage points. After Asian undergraduates (93.4%), international students had the second-highest rate (87.9%) of retention among all groups. American Indian and Alaska Native undergraduate students experienced the lowest retention rates at 63.6%.
Figure 6: Fall to Fall Retention by Race/Ethnicity for Illinois Public Universities
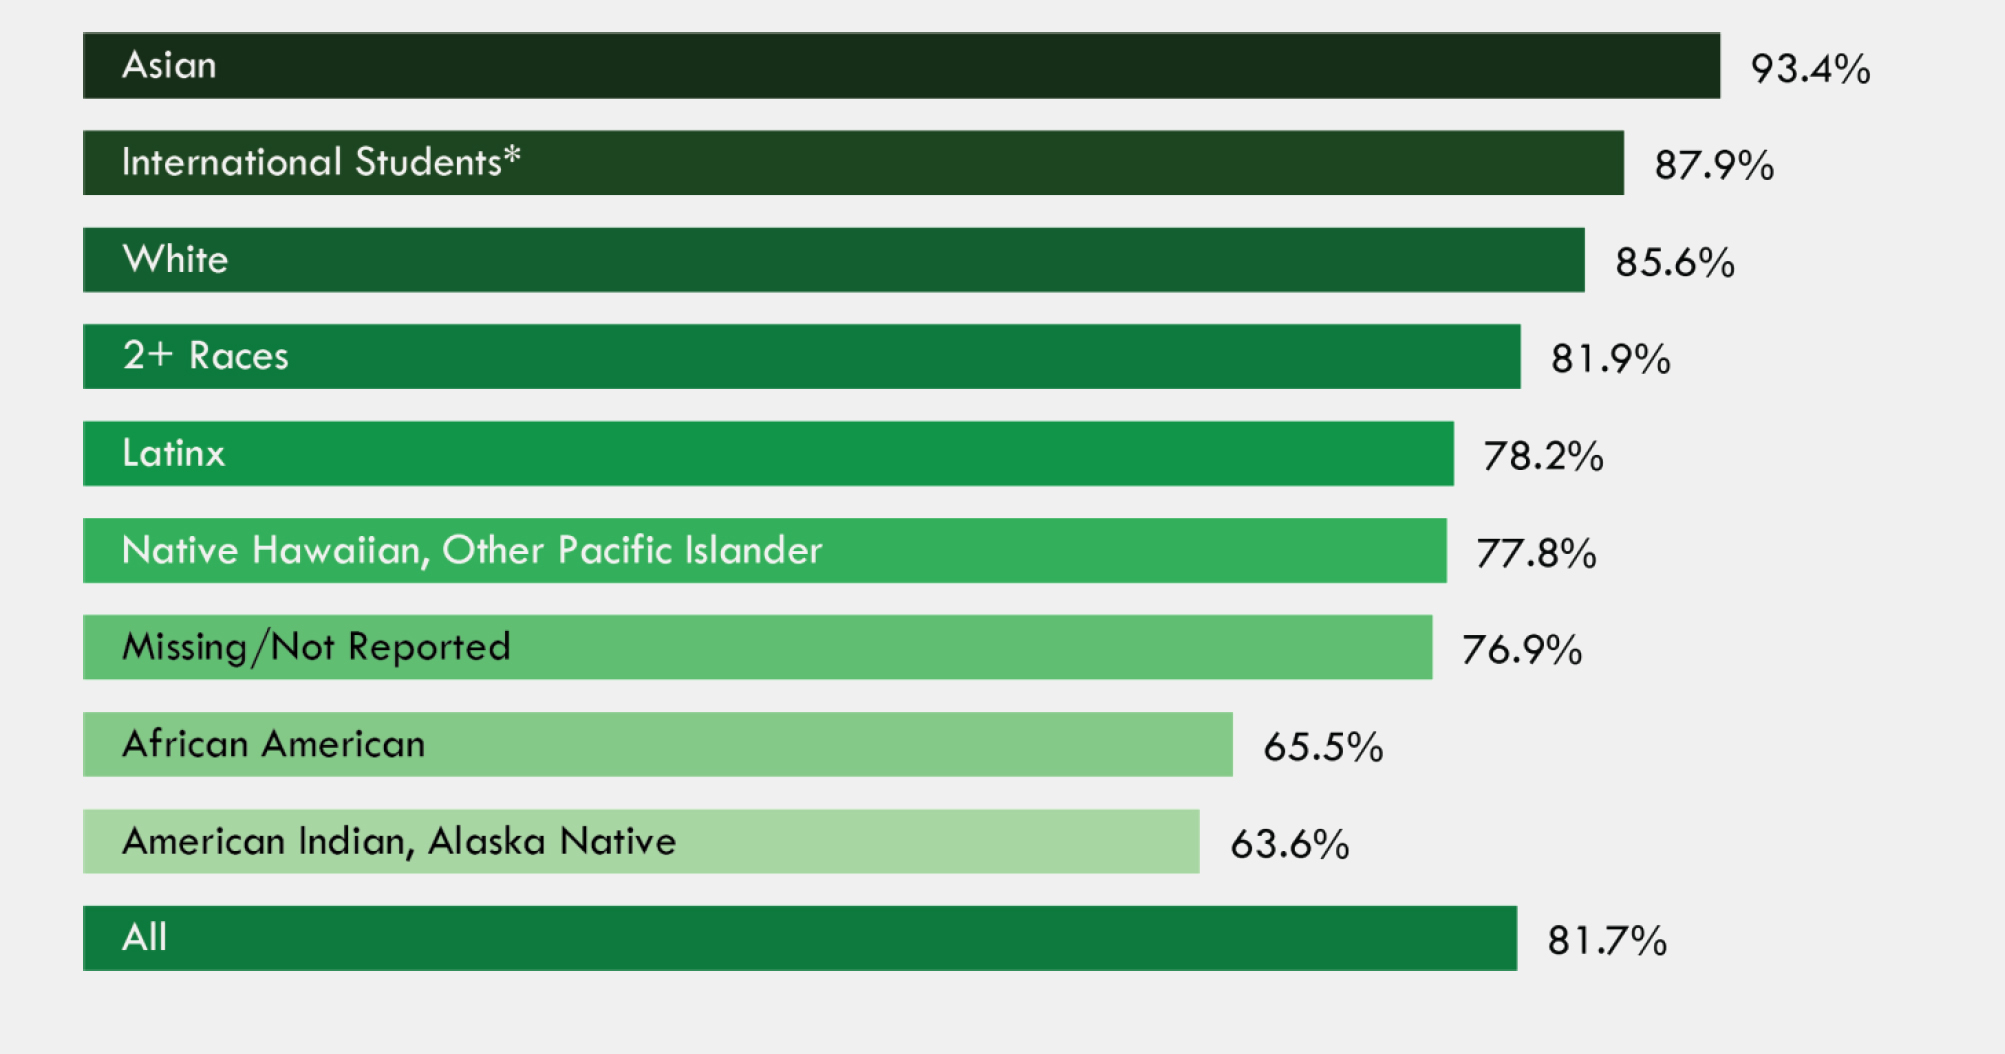
*A person who is not a citizen or national of the United States and who is in this country on a visa or temporary basis.
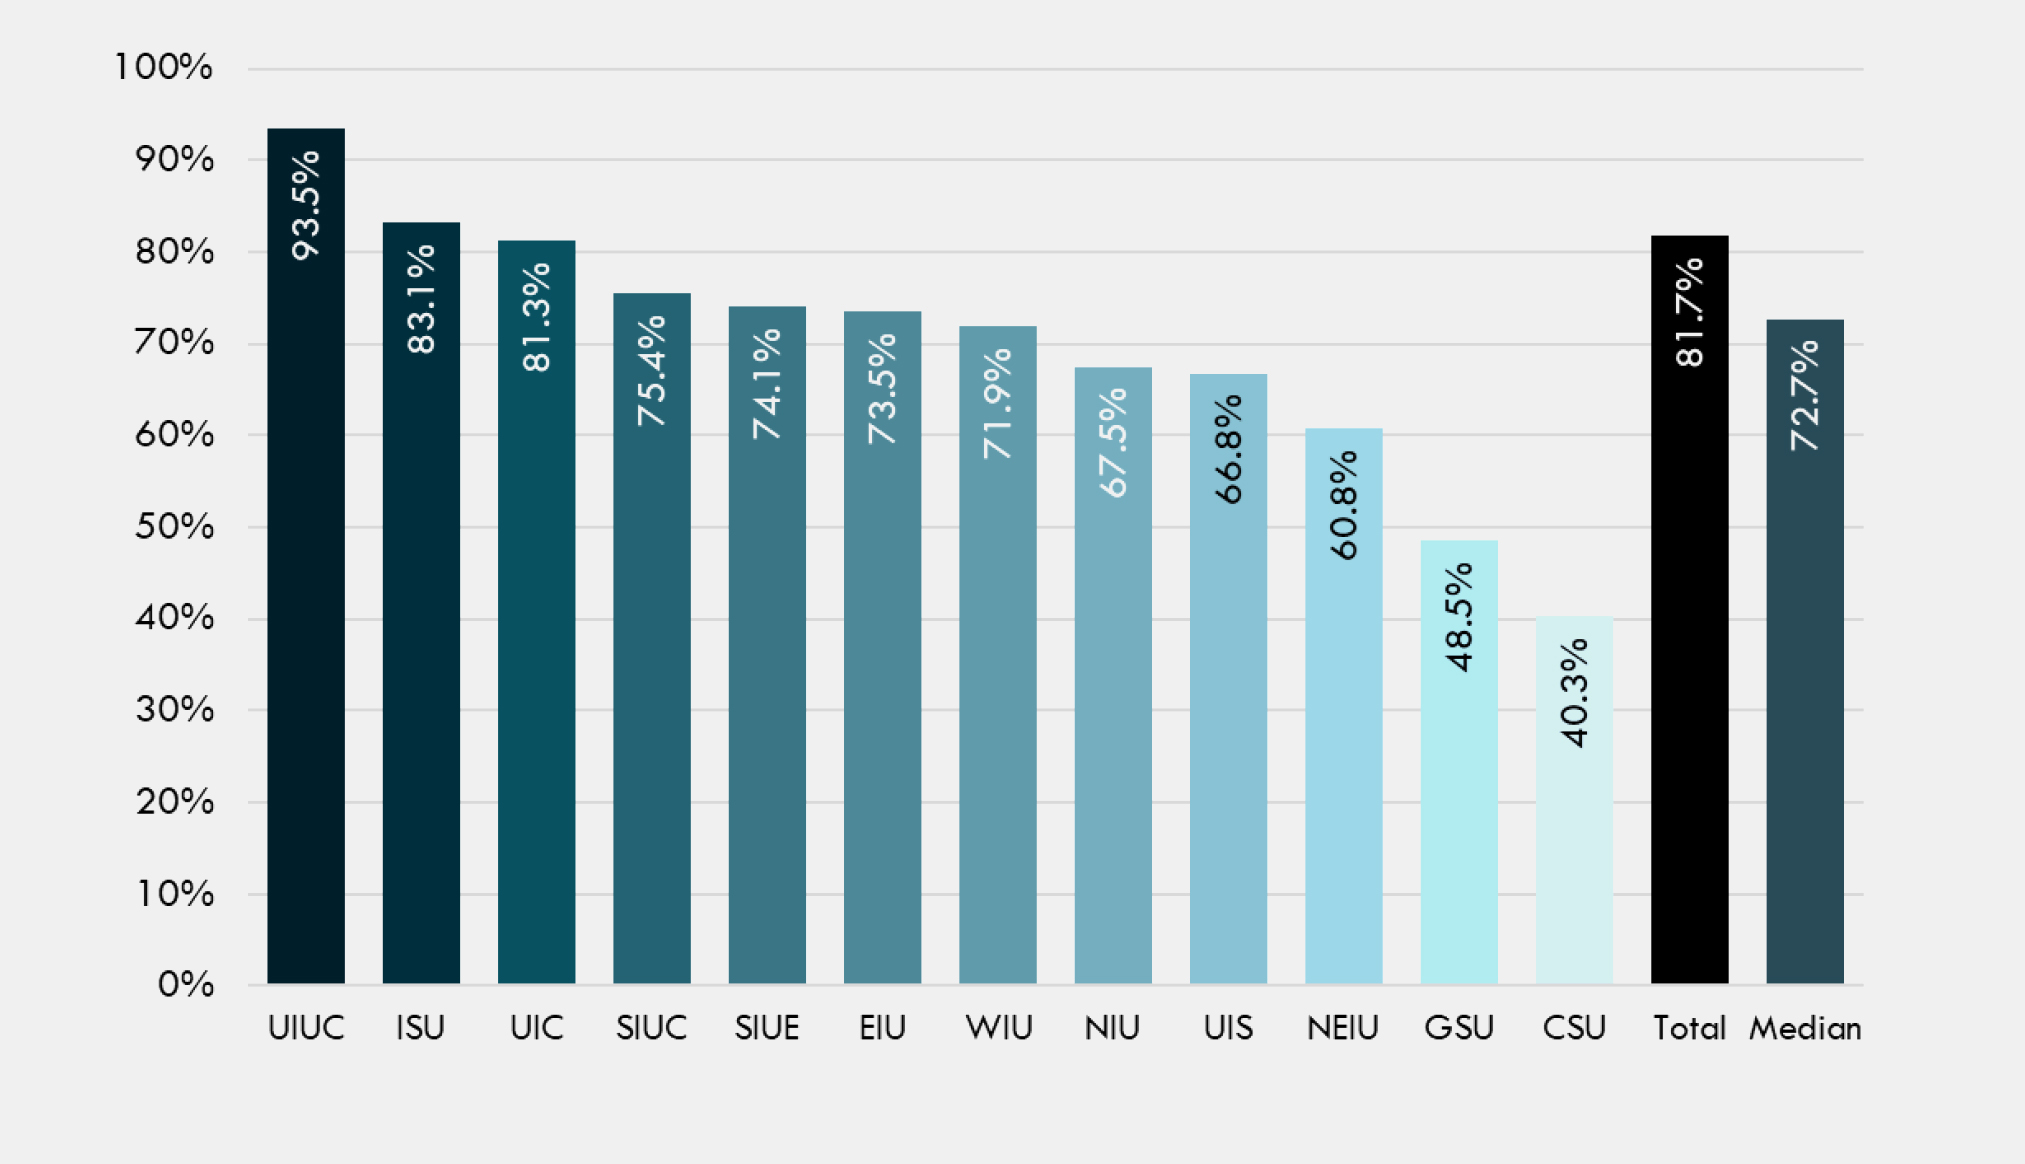
Fall to Fall Freshmen Retention. As shown in Figure 7, there was variation across the twelve Illinois public universities in terms of fall to fall retention for new freshmen from fall of academic year 2020-21. UIUC had the highest fall to fall retention rate at 93.5%, followed by ISU at 83.1%, while CSU and GSU had the lowest rates at 40.3% and 48.5%, respectively.
Figure 7: Fall to Fall Freshmen Retention by Illinois Public University
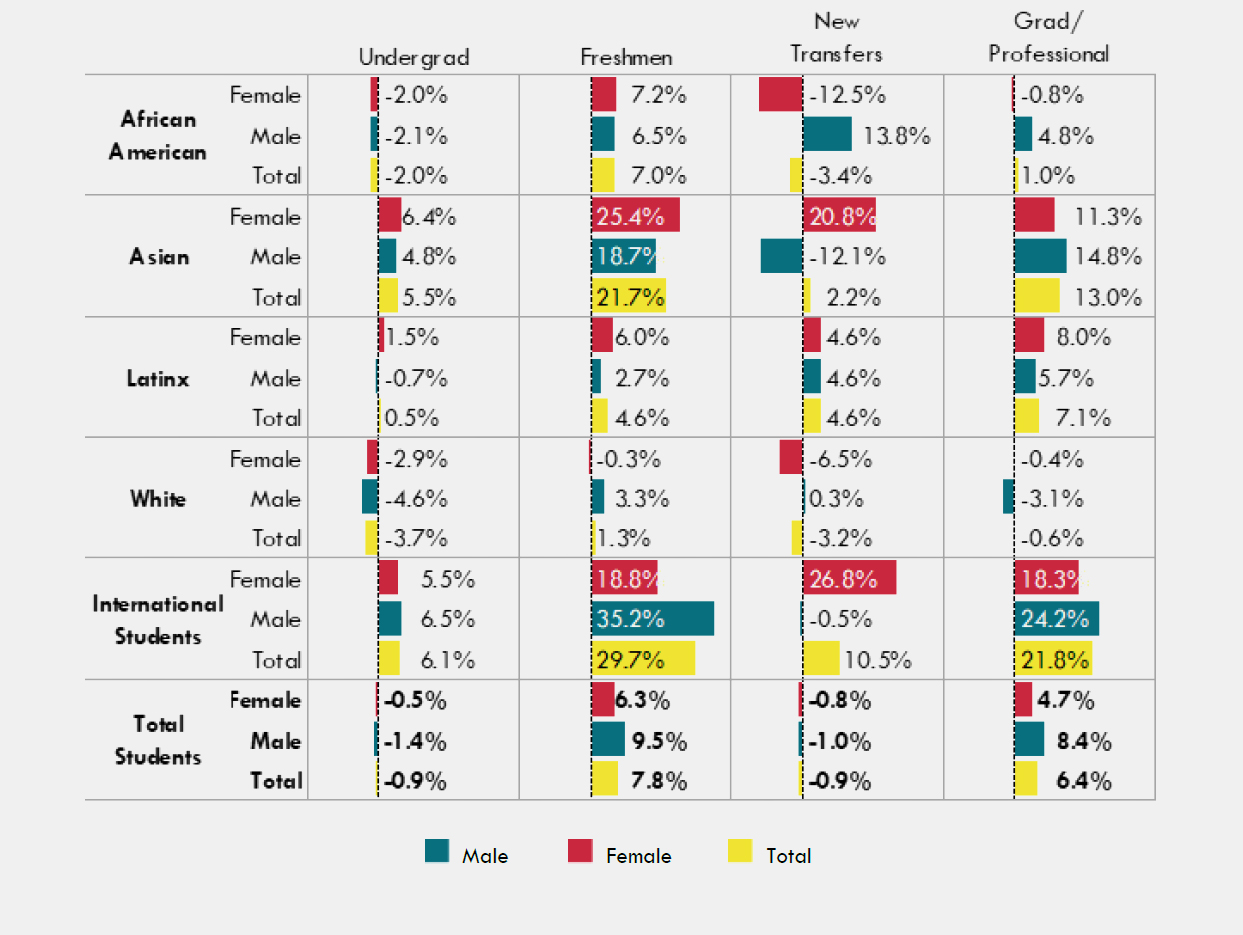
Enrollment by Race/Ethnicity and Gender
African American: African American undergraduate enrollment was down -2.0% at Illinois public universities, with males and females experiencing similar declines. However, enrollment of African American freshmen increased by 7.0%, with females experiencing a slightly larger increase. African American males experienced a moderate increase in graduate enrollment (+4.8%), while female enrollment was down slightly (-0.8%).
Asian: Asian undergraduate enrollment was up +5.5% at Illinois public universities, with females experiencing a slightly larger increase (6.4%) compared with males (4.8%). The public universities experienced particularly large annual growth in the number of Asian freshmen (+21.7%). There was a large increase in the number of Asian female transfer students (+20.8%), but the Asian male transfer students decreased at a rate of -12.1%.
Latinx: There was a slight increase in Latinx undergraduate enrollments at Illinois public universities (+0.5%), with the number of Latinx females increasing slightly (1.5%) and Latinx males decreasing slightly (-0.7%). The increase in Latinx freshmen equated to 4.6% growth year over year with larger growth in freshmen among Latinx females (+6.0%) compared to Latinx males (+2.7%). The growth in new Latinx transfer students was 4.6% and Latinx males and females experienced the same growth at Illinois public universities.
White: White students experienced enrollment declines across nearly across all of the enrollment types and gender groups except for freshmen (+1.3%) which was largely driven by the increase in male freshmen (+3.3%); and male transers (0.3%).
International: International students had year over year enrollment increases across all enrollment types and for both genders with the exception of new male transfer students (-0.5%) and even that change was fairly small.
Figure 8: Change in Headcount Enrollments at Illinois Public
Universities from 2020-21 to 2021-22 Male