IBHE FIRST LOOK – FALL ENROLLMENT 2023-24
Highlights
-
Total fall 2023 undergraduate enrollment at Illinois public universities was up slightly (+0.3%), reversing several consecutive years of decreases. An increase of 0.8% was reported for all public universities nationally. ¹
-
Overall, enrollment of new freshmen (+1.5%) and new transfer students (+0.8%) at Illinois public universities increased slightly, with stronger year-over-year growth in dual credit enrollment (+10.5%).
-
Fall 2023 marked the third consecutive year of growth in freshmen enrollment.
-
The increase in new freshmen at Illinois public universities (+1.5%) was significantly higher than all public universities nationally, which declined (-6.1%).
-
While enrollment of key groups of African American students dropped nationally for all public universities, enrollment of the same key groups in Illinois increased. In Illinois, enrollment of African American freshmen increased by 2.9%, and African American undergraduate enrollment was up 0.5% year-over-year. This is in stark contrast to the decreases reported at the national level. Nationally, enrollment of African American freshmen decreased by 5.1%, and African American undergraduate enrollment decreased by 0.4%.
-
Enrollment of key groups of Latino students at Illinois public universities also outpaced national trends. Latino freshmen enrollment in Illinois increased by a robust 6.9% while nationally it decreased by a sizeable 6.3%. Latino undergraduate enrollment increased 4.1% year-over-year at Illinois public universities, which was higher than the national 2.5% increase reported.
After several years of growth, graduate and professional enrollment at Illinois public universities decreased by 2.5%, equating to 1,443 fewer students. This decrease in Illinois differed from the 0.2% growth in graduate enrollment for all public universities nationally.
-
Overall, fall enrollment at Illinois public universities decreased by 0.6% from the previous fall.
-
More than eight out of every 10 (80.3%) new freshmen at Illinois public universities who were enrolled in the fall of the 2022-23 academic year were still enrolled in the fall semester of 2023-24. This represents the same retention rate for new freshmen from the prior year.
-
When disaggregated by race/ethnicity, there is more than a 27-percentage point gap in fall-to-fall retention between African American undergraduates (59.2%) and their white peers (86.5%). The gap widened compared to the previous year.
Overview
The Illinois Board of Higher Education (IBHE) has continued to collaborate with Illinois public universities to provide an early look at fall enrollment. Aligned with IBHE’s strong focus on equity as described in the 2021 strategic plan for higher education, A Thriving Illinois: Higher Education Paths to Equity, Sustainability, and Growth, this report provides enrollment and retention data by race and ethnicity, as well as information on more nuanced enrollment types, like dual credit and new undergraduate transfers.
¹ For all of the national comparisons, we used the following: National Student Clearinghouse Research Center. (October 26, 2023). First Look at Fall 2023 Highlights (as of September 28, 2023)
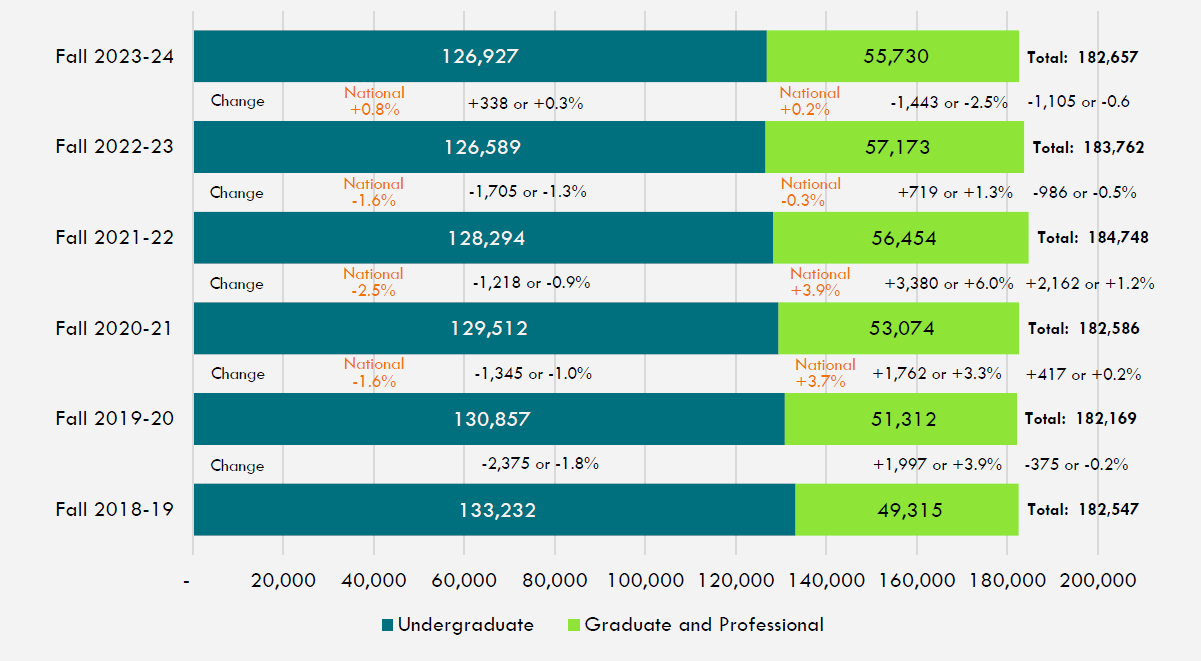
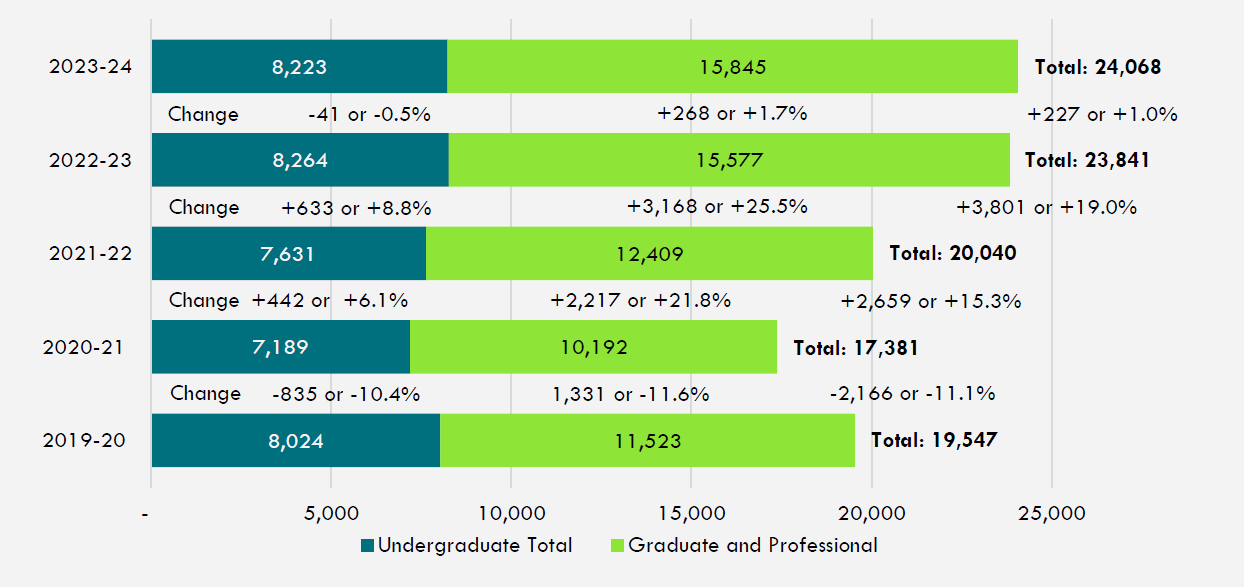
Illinois public universities currently enroll a similar total number of students as fall of 2018-19, 182,657, moving enrollment back to just above pre-pandemic levels. As shown in Figure 1, in fall of 2023, there was a 0.6% year-over-year decrease in total enrollment relative to fall of 2022-23, equating to roughly 1,100 fewer overall Illinois public university students. After several consecutive years of steady decreases in undergraduate enrollment, Illinois public universities reversed that trend and experienced a 0.3% year-over-year increase, resulting in 338 additional undergraduate students. Conversely, after several consecutive years of growth in graduate and professional enrollment, Illinois public universities experienced a decrease of 2.6%, or roughly 1,400 fewer students, driving the overall Illinois public university student enrollment decrease.
Figure 1: Illinois Public University Headcount Enrollments
from Fall of Academic Year 2018-19 to 2023-24
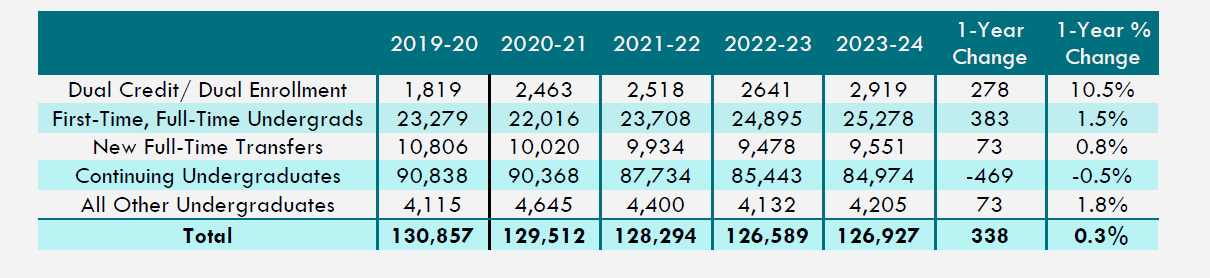
Undergraduate Enrollment. As shown in Table 1, undergraduate enrollment was up 0.3% in the fall of academic year 2023-24, reversing several consecutive years of undergraduate enrollment decreases. The increase represented 338 additional undergraduate students at Illinois public universities relative to academic year 2022-23.
New first-time, full-time undergraduates at Illinois public universities (generally freshmen) increased by 1.5%, with a somewhat smaller proportional increase among new transfer students (+0.8%). There was a double-digit year-over-year increase in the number of dual credit/dually enrolled students of 10.5%, equating to an additional 278 students in that category. However, there was an overall decrease of 0.5% in continuing undergraduates, which is the largest category of undergraduate students.
Table 1: Undergraduate Enrollment Type for Illinois Public Universities (Headcount)
Graduate and professional enrollment.As shown in Figure 1, graduate and professional enrollment at Illinois public universities decreased by more than 1,400 students, or 2.5%. The decrease in fall of academic year 2023-24 reversed several consecutive years of growth at the graduate and professional levels.
As undergraduate enrollment was up slightly (+0.3%) and comprises a much larger share of overall enrollment (69.5%), when combined with the 2.5% decrease graduate and professional enrollment, total enrollment at Illinois public universities was down by slightly more than 1,100 students (0.6%) compared to academic year 2022-23. This was similar to the overall decrease from the prior year (-0.5%), which was due to lower undergraduate enrollments.
Institutional Highlights and Detailed Enrollment
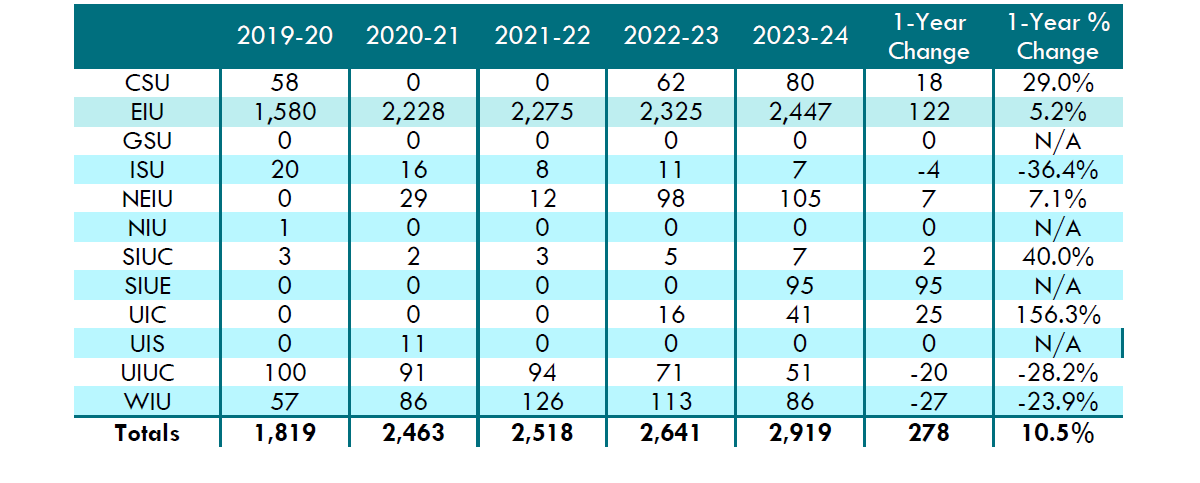
Dual Credit/Dual Enrollment. As shown in Table 2, dual credit enrollment was up by 10.5% (+278). This was driven by modest year-over-year growth at Eastern Illinois University (EIU) and large proportional year-over-year growth at Southern Illinois University Edwardsville (SIUE), which started a new dual credit program in academic year 2023-24 and enrolled 95 students. The number of students enrolled in dual credit at the University of Illinois Chicago (UIC) increased from 16 to 41. At nearly 84%, EIU still accounts for the largest proportion of dual credit enrollment among Illinois public universities. In fall of 2023-24, nine Illinois public universities reported dual credit/dual enrollment students, which was up from eight universities the year before. The University of Illinois Urbana-Champaign (UIUC) (-28.2%), Western Illinois University (WIU) (-23.9%), and Illinois State University (ISU) (-36.4%) experienced decreases in students enrolled in dual credit.
Table 2: Dual Credit/Dual Enrollment at Illinois Public Universities (Headcount)
First-Time, Full-Time Undergraduates
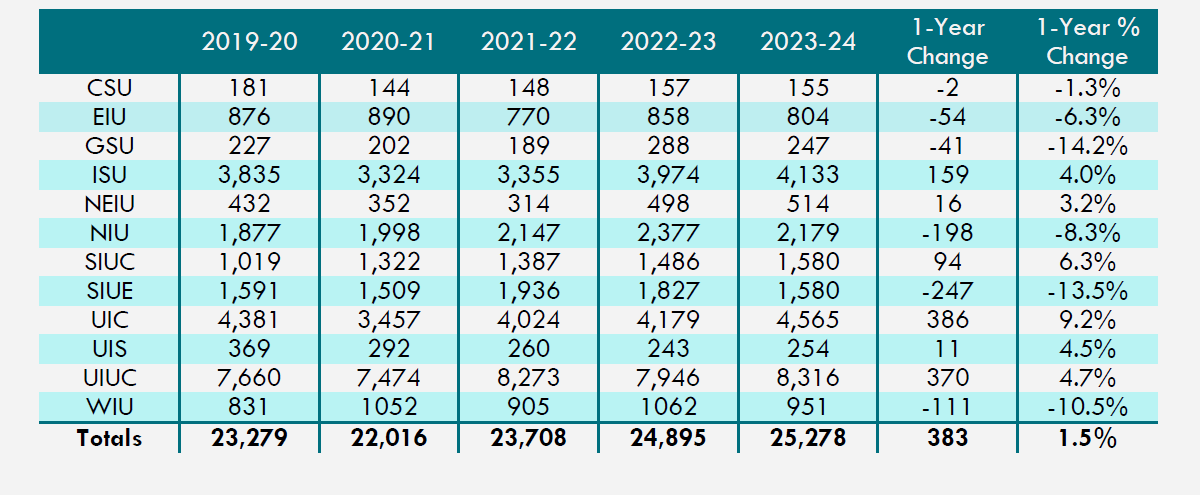
As shown in Table 3, half of the state’s 12 public universities experienced growth in the number of first-time, full-time undergraduates or incoming freshmen in academic year 2023-24 compared to the fall semester of the prior year. Fall 2023 marked the third consecutive year of growth and the highest recent number of full-time freshmen at Illinois public universities, representing 25,278 new freshmen. This recent growth occurred after a large year-over-year decrease of 5.4% during the first full academic year after the start of the pandemic (fall of academic year 2020-21).
The year-over-year growth in freshmen enrollment varied across the Illinois public universities and resulted in the recent high-water mark for freshmen enrollment at several Illinois public universities including ISU, Northeastern Illinois University (NEIU), Southern Illinois University Carbondale (SIUC), UIC, and UIUC. With over 4,100 freshmen, freshmen enrollment at ISU is significantly higher than any recent year and surpassed its pre-pandemic high in 2019-20. NEIU continued to grow its freshmen class and experienced an annual increase of 3.2%. Freshmen enrollment at UIUC increased 4.7% year-over-year to over 8,300 students. With a year-over-year increase of 9.2%, UIC experienced its third consecutive year of growth in freshmen enrollment and has now surpassed its pre-pandemic high of 4,381 freshmen students in fall of 2019-20. SIUC enrolled 1,580 new freshmen in 2023-24, with its fourth consecutive year of growth. This occurred after a recent low of slightly more than 1,000 new freshmen in the fall of 2019-20, indicating SIUC grew its freshmen enrollment by 55% in the timeframe since. Chicago State University (CSU) experienced stable freshmen enrollment.
After a large increase the prior year, Governors State University (GSU) experienced a decrease of 14.2%, but freshmen enrollment was still slightly higher than pre-pandemic levels in 2019-20. After large growth in the prior year, WIU and Northern Illinois University (NIU) both experienced decreases in freshmen enrollment of 10.5% and 8.3% respectively. SIUE had a decrease of 13.5% in its full-time freshmen class in academic year 2023-24, its smallest size since the year after the beginning of the pandemic.
Table 3: First-Time Full-Time Undergraduates (Freshmen) at Illinois Public Universities (Headcount)
New Full-Time Transfer Students.
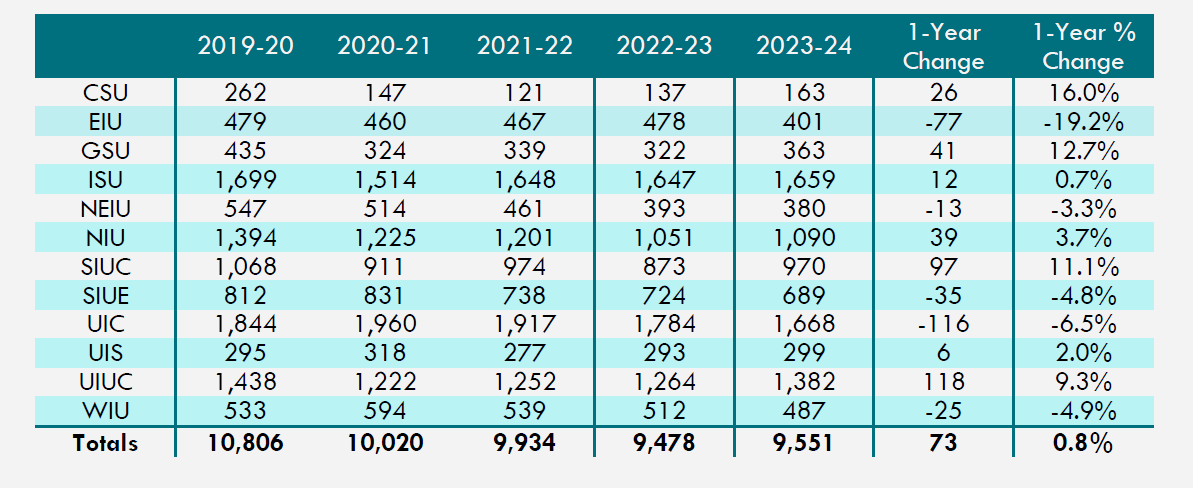
As shown in Table 4, new full-time transfer enrollment was up slightly compared to the previous year. In academic year 2023-24, 73 additional new transfer students enrolled across all the Illinois public universities. Seven of the 12 Illinois public universities experienced year-over-year growth in new transfers, led by CSU at 16%, GSU at 12.7%, SIUC at 11.1%, and UIUC at 9.3%. Eastern Illinois University (EIU), UIC, WIU, and SIUE experienced decreases in new transfer students of 19.2%, 6.5%, 4.9%, and 4.8%, respectively.
This growth was not enough to overcome the new transfer enrollment decrease of 11.6% relative to fall of 2019-20. However, with Illinois community college enrollment increasing in academic year 2022-23 (+1.4%) and with even stronger enrollment growth in academic year 2023-24 (+5.6%)², these recent gains should contribute to additional transfer growth at the Illinois public universities in the coming years.
Table 4: New Full-Time Transfer Students at Illinois Public Universities (Headcount)
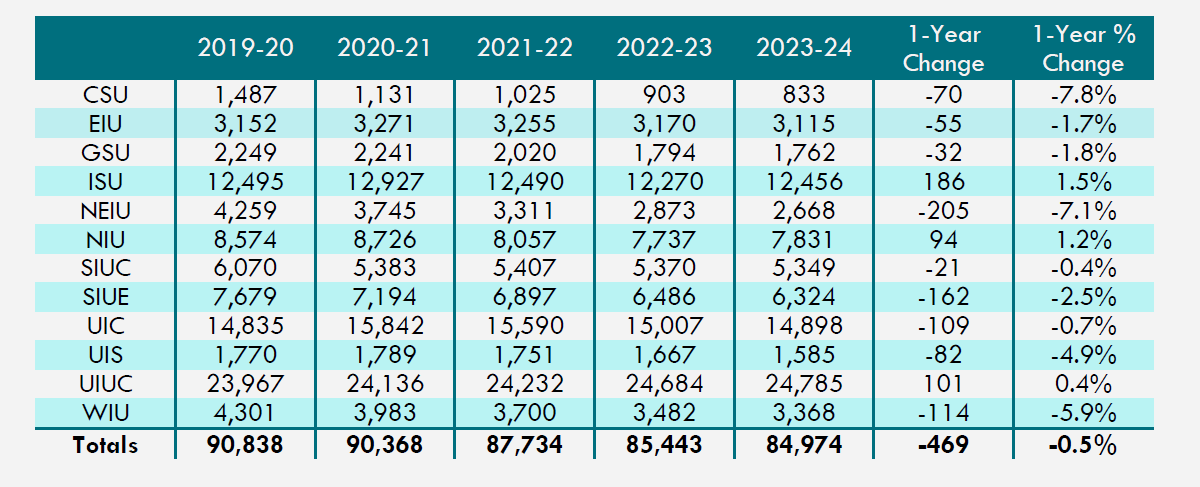
Continuing Undergraduate Students.As shown in Table 5, there were 469 fewer continuing undergraduate students in 2022-23 compared to 2023-24, a decrease of 0.5%. The decrease in academic year 2023-24 was smaller than the previous two year-over-year decreases (comparing 2020-21 to 2021-22 and 2021-22 to 2022-23).
All Illinois public universities, except ISU, NIU, and UIUC, experienced a decrease in the number of continuing undergraduate students. The year-over-year proportional decreases in number of continuing undergraduates ranged from 0.4% at SIUE to 7.8% at CSU. NEIU experienced the largest decrease in the number of continuing undergraduate students at 205, followed by SIUE at 162, and WIU at 114.
Table 5: Continuing Undergraduate Students at Illinois Public Universities (Headcount)
² ICCB Fall 2023 Illinois Community College Opening Enrollment Report
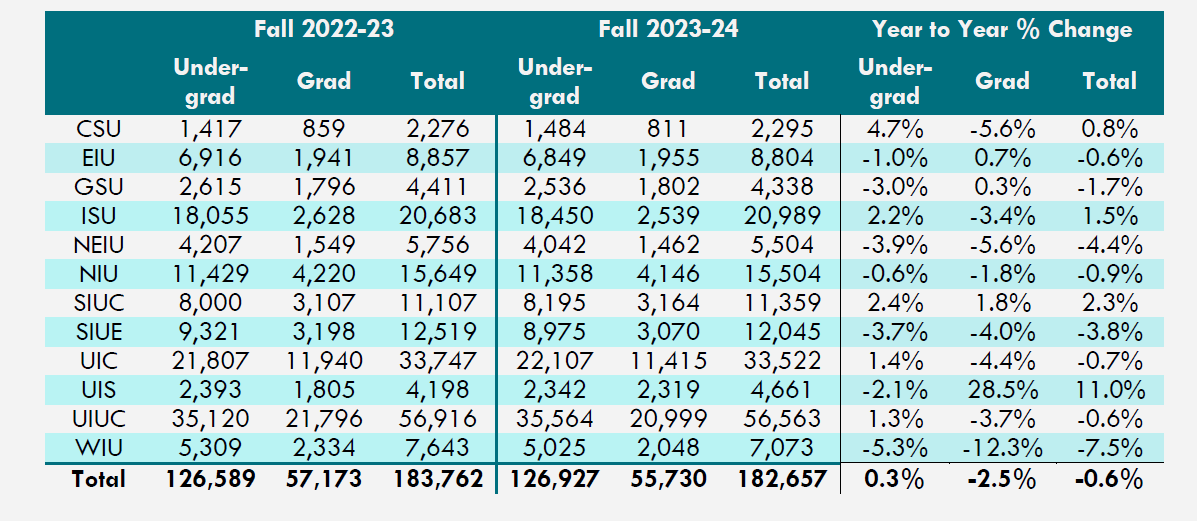
Graduate and Undergraduate Enrollment Summary. As shown in Table 6, total enrollment decreased by 0.6%, with a 0.3% overall increase at the undergraduate level along with 2.5% decrease in graduate/professional enrollments.
Five of the 12 Illinois public universities experienced undergraduate enrollment growth: CSU at 4.7%, SIUC at 2.4%, ISU at 2.2%, UIC at 1.4%, and UIUC at 1.3%. WIU (-5.3%), NEIU (-3.9%), and SIUE (-3.7%) had the largest undergraduate enrollment decreases.
At the graduate level, Illinois enrollment decreased by 2.5% while public universities saw an increase of 0.2% at the national level. Four of the 12 Illinois public universities experienced growth in graduate/professional enrollment compared to fall of 2022-23 with three institutions experiencing only marginal annual growth-- SIUC (+1.8%), EIU (+0.7%), and GSU (+0.3%). UIS experienced the largest growth in graduate/professional enrollment at 28.5%. WIU experienced the largest decrease in graduate/professional enrollment at 12.3% followed by NEIU and CSU at 5.6%.
Table 6: Enrollments and Year to Year Change (Headcount)
Enrollment Patterns by Race/Ethnicity
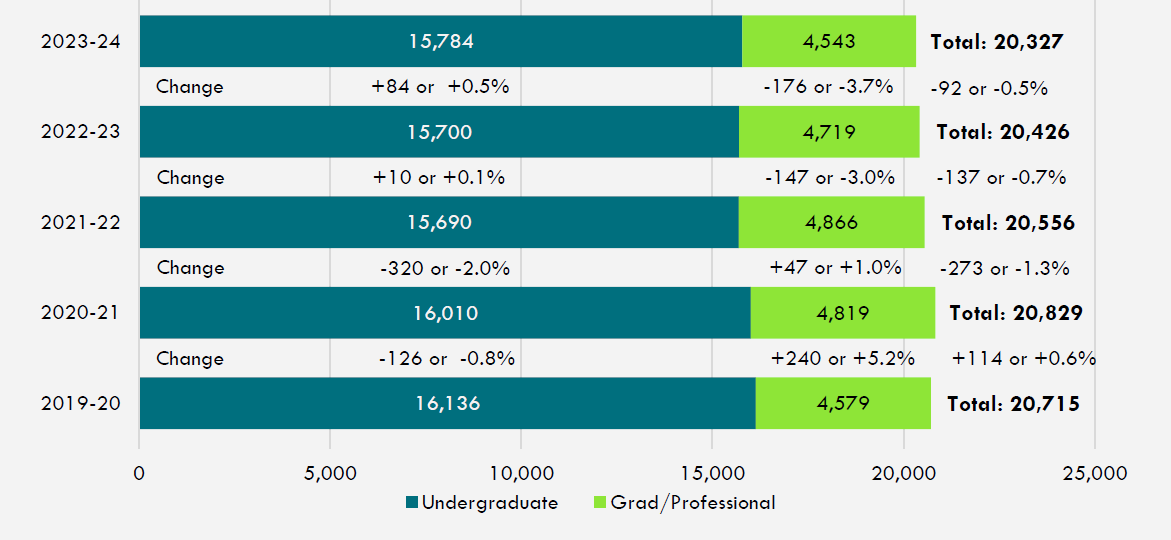
Enrollment African American Enrollments. As shown in Figure 2, overall African American student enrollment at Illinois public universities was down 0.5% to 20,327 students in 2023-24, representing roughly 100 fewer African American students. Undergraduate enrollment of African American students increased slightly year-over-year by 0.5% (an increase of 84 students). At the same time, there was a 0.4% decrease in African American undergraduate enrollment at public universities nationally.
At Illinois public universities, graduate and professional enrollment of African American students decreased by 3.7% to 4,543 students, which fully eliminated the growth made after the pandemic began. This helped to drive the overall drop in African American enrollment at Illinois public universities. The decrease at Illinois public universities (-3.7%) differed from the 1.4% increase in African American graduate/professional enrollment that was reported nationally across all public universities.
Figure 2: Headcount Enrollment of African American Students at Illinois Public Universities
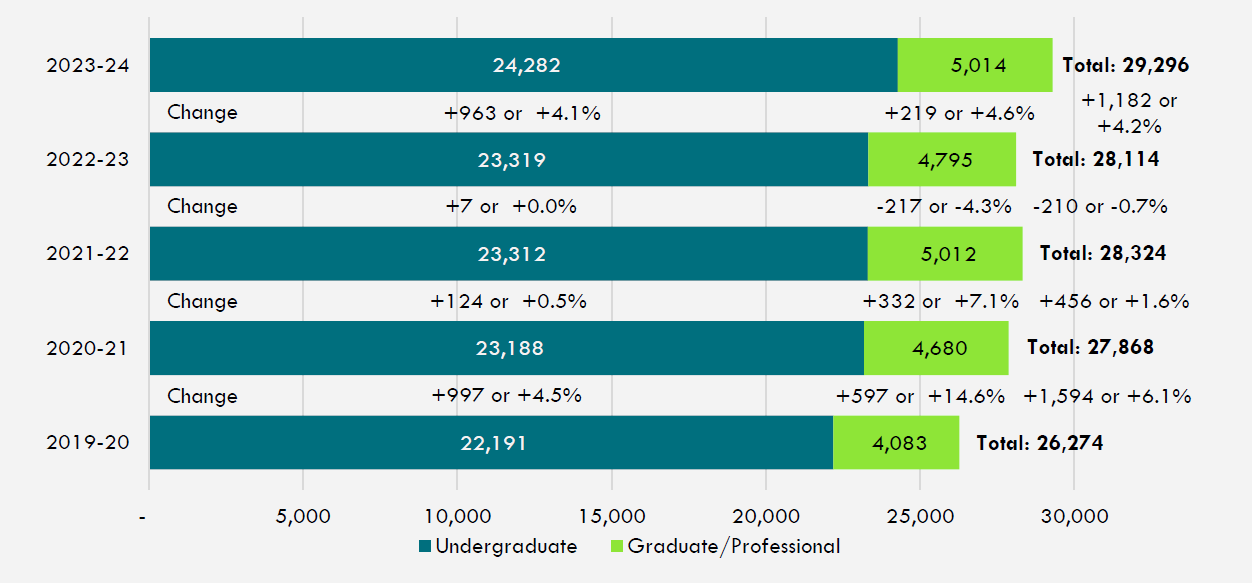
Enrollment of Latino Students. As shown in Figure 3, total Latino student enrollment at Illinois public universities increased by 4.2%, representing nearly 1,200 additional students compared to fall of 2022-23. This occurred after a slight overall decrease of 0.7% the prior year. Latino undergraduate enrollment was up by 4.1%, which was higher than the Latino undergraduate enrollment growth that was reported nationally for all public universities of 2.5%.
At the graduate/professional level, enrollment of Latino students increased 4.6%, which eliminated the decrease from the prior year. The increase in academic year 2023-24 mirrors the Latino graduate student enrollment high-water mark from 2021-22 (slightly above 5,000 students). The year-over-year increase in Latino graduate enrollment at Illinois public universities was slightly larger (+4.6%) than what was reported nationally for all public universities (3.6%).
Figure 3: Headcount Enrollment of Latino Students at Illinois Public Universities
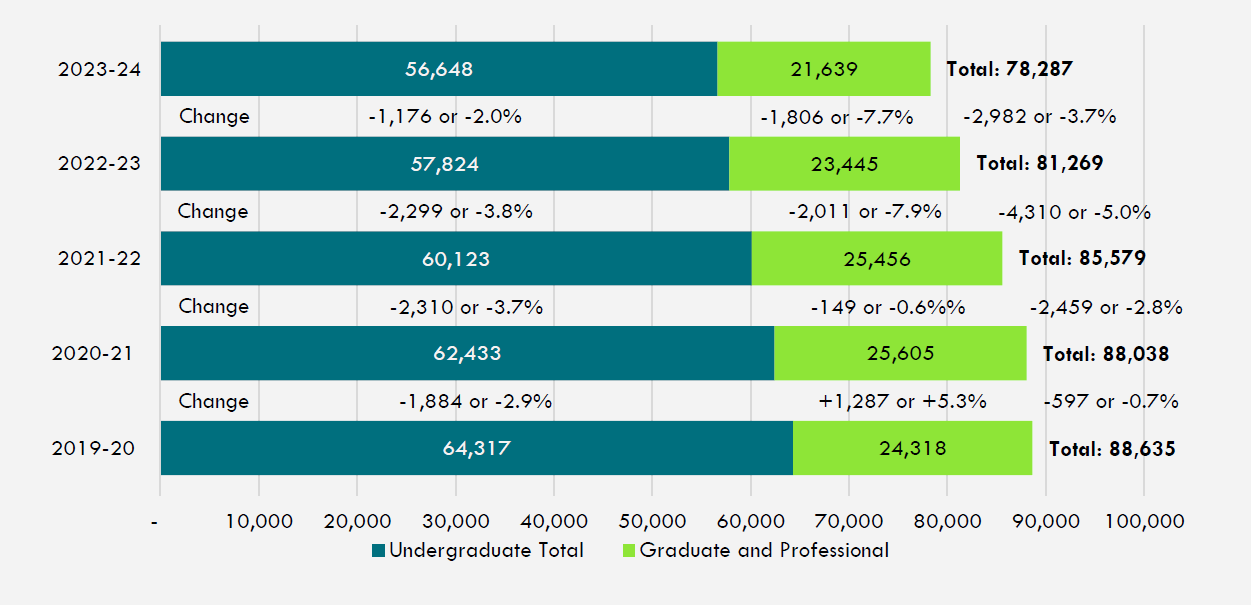
Enrollment of White Students. As shown in Figure 4, overall, there were nearly 3,000 fewer white students enrolled at Illinois public universities in 2023-24, representing an enrollment loss of 3.7%. Undergraduate enrollment of white students was down 2.0%, representing 1,176 fewer students. This decrease was somewhat similar to the -1.7% year-over-year change in white undergraduate enrollment nationally. Since the fall of 2019-20, there are nearly 7,700 fewer white undergraduate students enrolled at Illinois public universities.
The year-over-year change in white graduate student enrollment at Illinois public universities was -7.7%, representing 1,800 fewer white students. This loss was more acute compared to the national year-over-year change of -2.3% across all public universities.
Figure 4: Headcount Enrollment of White Students at Illinois Public Universities
International Student Enrollments. As shown in Figure 5, overall enrollment growth of international students at Illinois public universities slowed in 2023-24 with a 1% increase relative to the 19% increase in 2022-23.
Although there was a small decrease in the number of international undergraduate students at Illinois public universities of 41 (-0.5%), enrollment of international graduate/professional students increased by 268 (+1.7%). The increase in international graduate enrollment at Illinois public universities was not as sizable as the 6.7% increase nationally.
Figure 5: Headcount Enrollment of International Students at Illinois Public Universities
Fall to Fall Retention by Race/Ethnicity. As shown in Figure 6, more than eight out of every 10 (80.3%) new freshmen at Illinois public universities who were enrolled in the fall of 2022-23 were still enrolled in the fall semester of 2022-23 (reported as 2023). This represented the exact same rate as the prior year. However, gaps were evident when retention rates were disaggregated by race/ethnicity. A retention gap of more than 27 percentage points was evident between African American undergraduates (59.2%) and their white peers (86.5%). This gap was much higher than the prior year. The retention gap between Latino undergraduates and their white counterparts was around 11 percentage points. After Asian undergraduates (91.9%), white and international students had the highest rates (86.5% and 85.8%, respectively) of retention among all groups.
Figure 6: Fall to Fall Retention by Race/Ethnicity for Illinois Public Universities
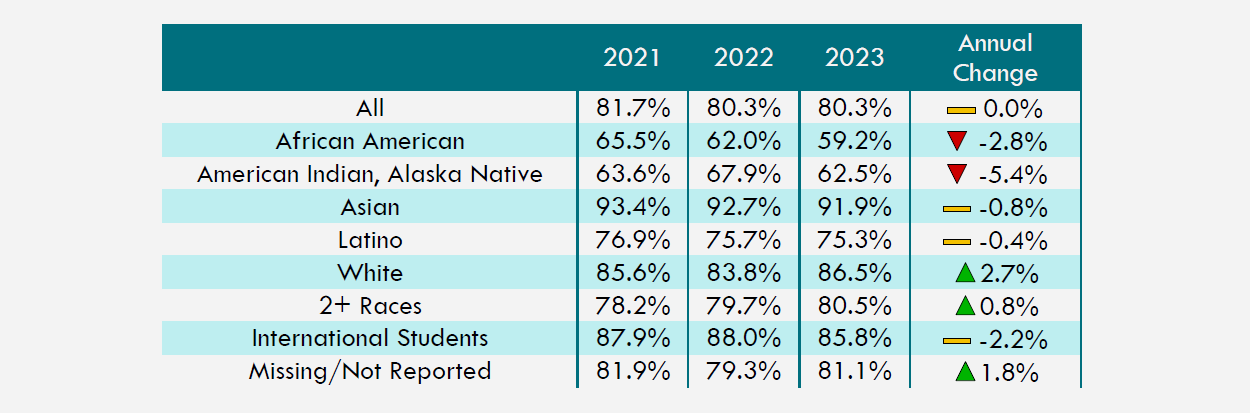
*A person who is not a citizen or national of the United States and who is in this country on a visa or temporary basis.
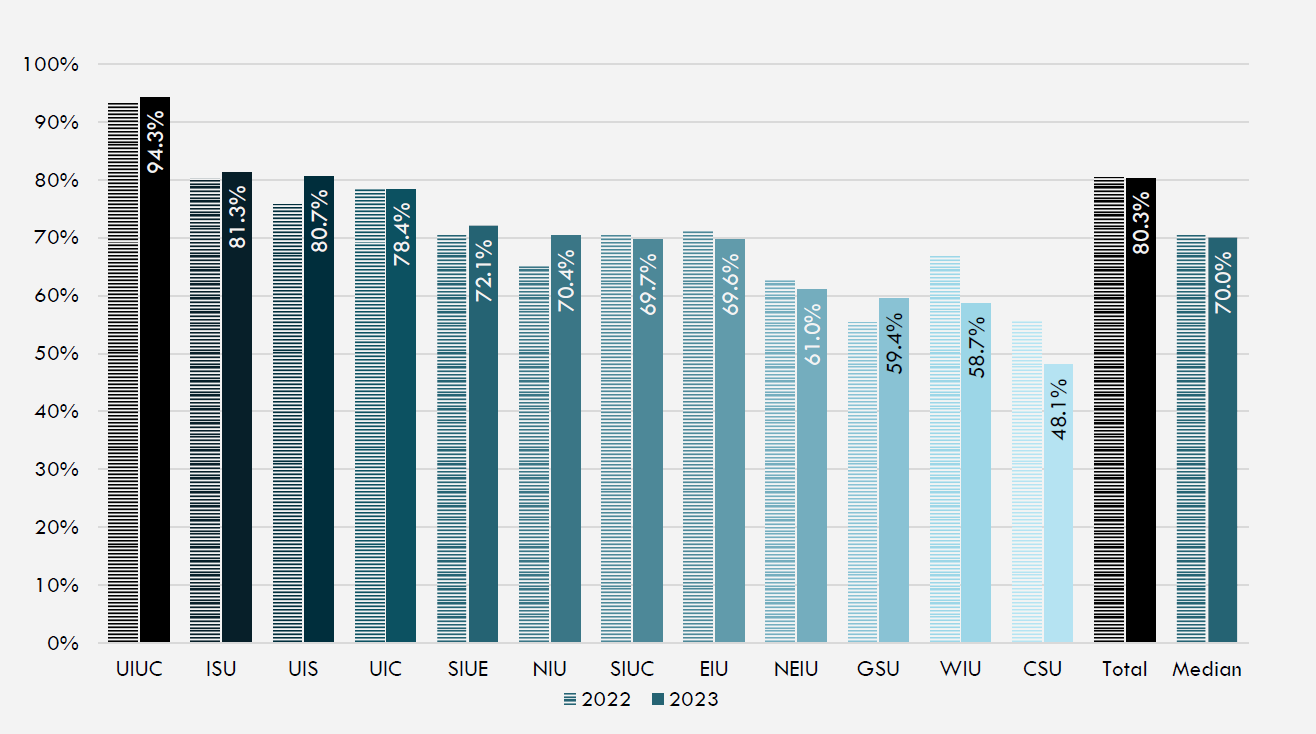
Fall to Fall Freshmen Retention.As shown in Figure 7, there was variation across the 12 Illinois public universities in retention of new freshmen from fall of academic year 2022-23 to fall of 2023-24 (reported as 2023). UIUC continued to have the highest retention rate at 94.3% followed by ISU at 81.3%. CSU had the lowest rate at 48.1%. UIS (+4.9%), NIU (+5.1%), and GSU (+4.1%) experienced comparatively large increases in freshmen retention year-over-year. WIU and CSU experienced the largest decreases in freshmen retention from 2022 to 2023 at 8.1% and 7.7%, respectively.
Figure 7: Fall to Fall Freshmen Retention by Illinois Public University
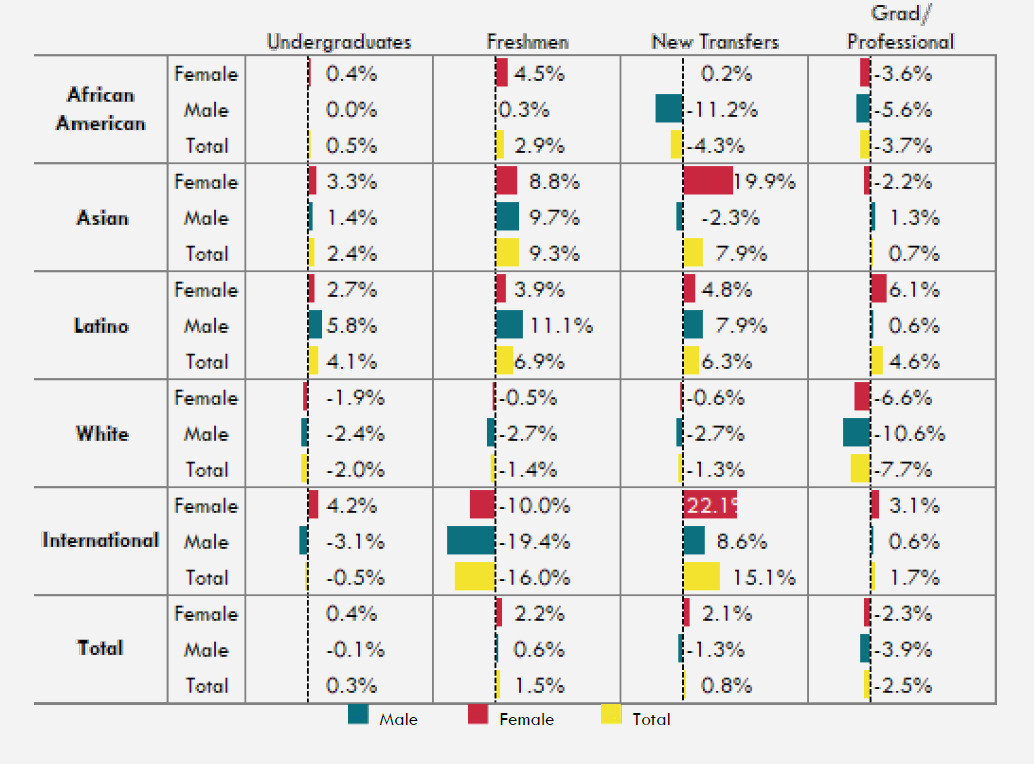
Enrollment by Race/Ethnicity and Gender
African American: African American undergraduate enrollment was up slightly at Illinois public universities, with males experiencing flat enrollment and females driving the overall increase (+0.4%). Enrollment of African American freshmen increased by 2.9% year-over-year, with African American females driving the overall growth (+4.5%) and only slight enrollment growth among males (+0.3%). African American males experienced a large decrease in transfer enrollment (-11.2%), resulting in the overall decrease, while female transfer enrollment was mostly flat (+0.2%).
Asian: Asian undergraduate enrollment at Illinois public universities increased across all undergraduate enrollment types for males and females alike, except for new transfer enrollment for Asian males (-2.3%). Graduate/professional enrollment of Asian males increased slightly (+1.1%) while enrollment of Asian females decreased 2.2% year-over-year.
Latino: Latino enrollment increased across all enrollment types for both males and females. With all undergraduate enrollment types, Latino males had stronger growth than their female counterparts. Latino females experienced stronger growth in graduate enrollment (+6.1%) compared to their male peers (+0.6%) and, therefore, contributed more to the overall increase in Latino graduate enrollment.
White:White students experienced enrollment decreases across nearly across all enrollment types with males experiencing larger decreases than their female counterparts. The largest decreases were in graduate/professional enrollment, where enrollment of white males decreased by 10.6% and enrollment of females decreased by 6.6%.
International: International students had large year-over-year increases in transfer enrollment for males and females, with large decreases in freshmen enrollment. Overall undergraduate enrollment for international students was up for females (+4.2%) and down for males (-3.1%). Growth in graduate and professional enrollment among international students was more muted, with females driving the overall growth.
Figure 8: Change in Headcount Enrollments at Illinois Public
Universities
from fall of 2022-23 to 2023-24