IBHE FIRST LOOK FALL ENROLLMENT
Illinois Public Universities
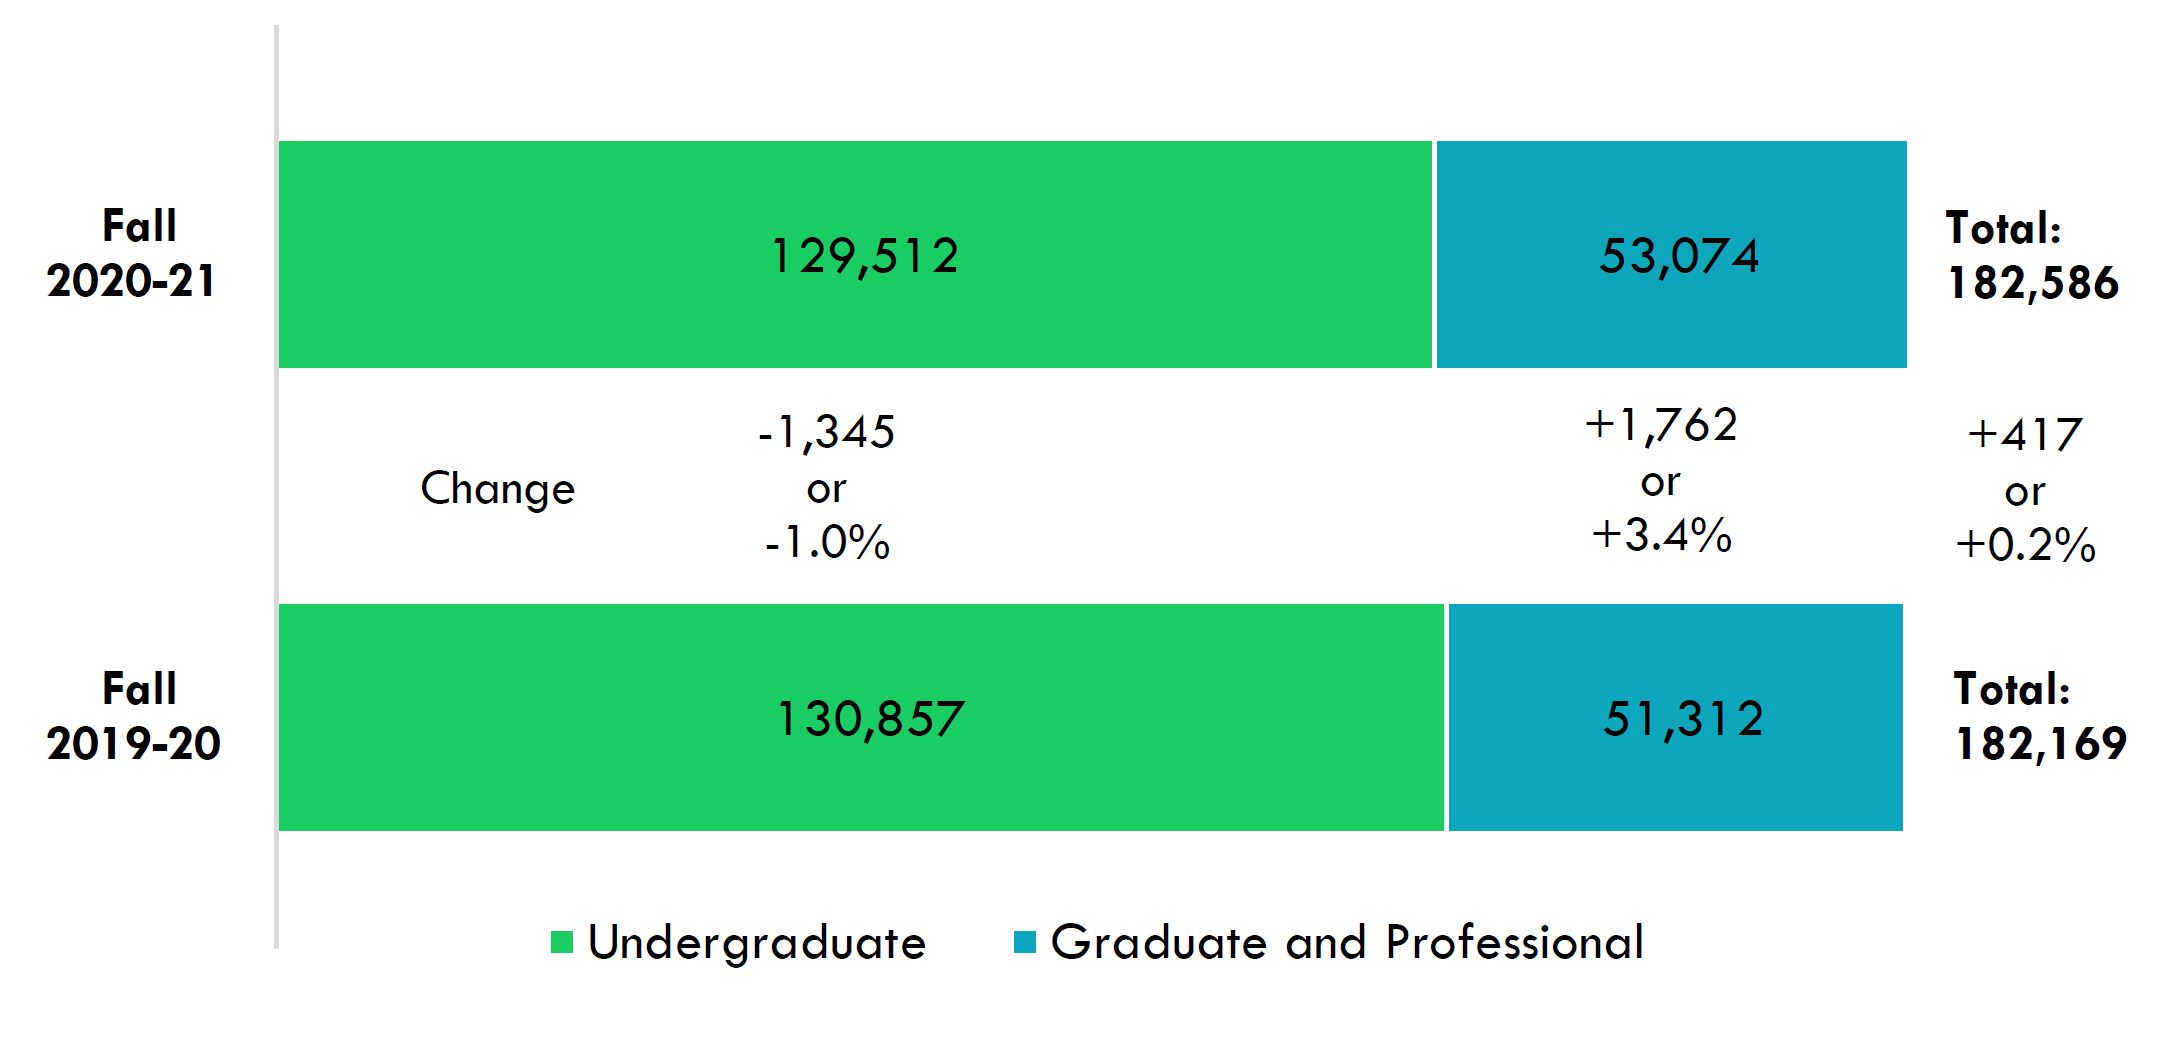
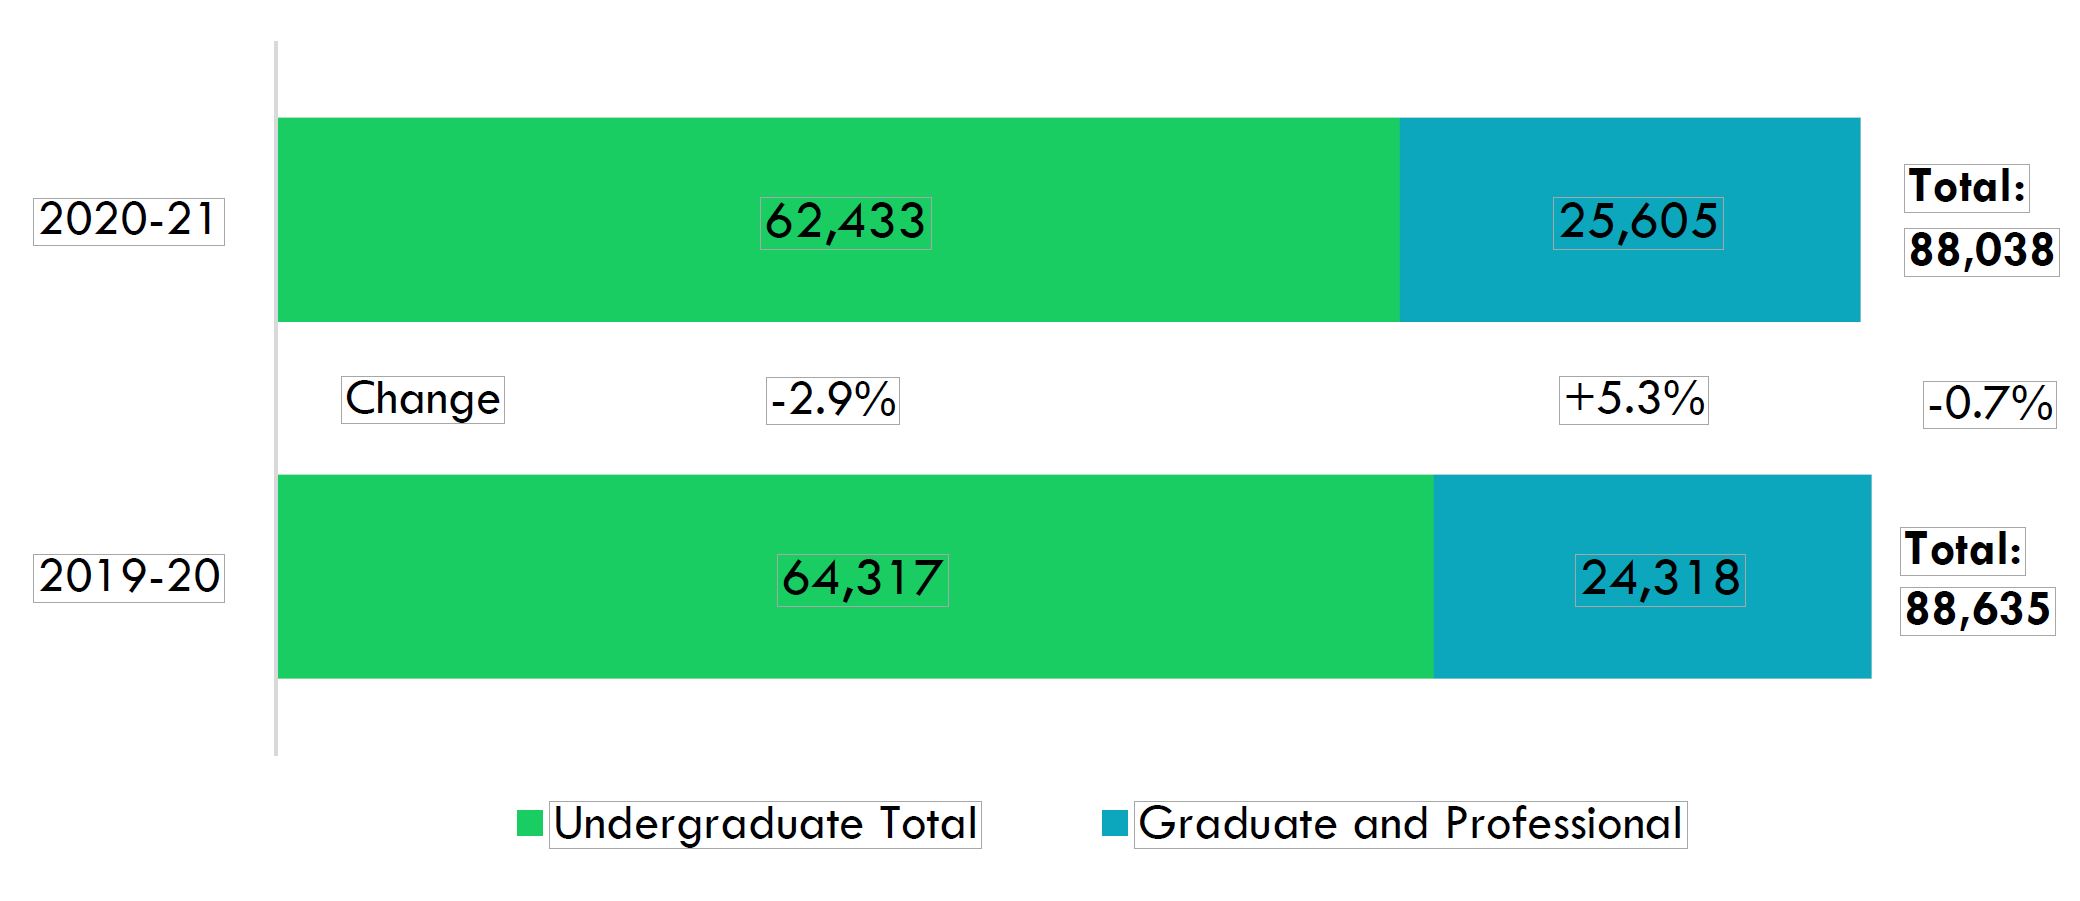
Overall fall enrollment at Illinois public universities increased slightly relative to last year (+0.2%).
Undergraduate enrollment was down by -1.0% and graduate/professional enrollment was up 3.4%.
Overall African American enrollments were up 0.6% at Illinois public universities, with notable increases in new freshmen (3.2%) and graduate/professional enrollments (5.2%), but a large decline in new transfer enrollments (-17.4%).
Latinx enrollments were up 6.1% at Illinois public universities, with growth in graduate/professional enrollments (14.6%) and overall undergraduate enrollments (4.5%).
There were overall declines in the number of new first-time full-time undergraduates (-5.4%) and new full-time transfers (-7.3%).
The number of continuing undergraduate students was down slightly (-0.5%) and the number of dual credit students increased by 35.4%, while part-time and non-degree seeking students increased by 11.8%.
Non-resident aliens experienced comparatively large year over year declines in both undergraduate (-10.4%) and graduate/professional enrollments (-11.6%).
Overview
Each year, IBHE issues a “first look” at Fall enrollment. In light of the COVID-19 pandemic and IBHE’s focus on equity, IBHE collaborated with the Illinois public universities to collect enrollment information for academic year 2020-21 with a first-ever early look at equity . In addition to providing information on some of the more nuanced enrollment types, like dual credit and new undergraduate transfers, the interaction of race/ethnicity and gender specific to fall enrollment is also included in the report.
As shown in Figure 1, when undergraduate and graduate/professional enrollments are combined, there was a marginal increase in total enrollment relative to fall of academic year 2019-20. Illinois public universities enrolled 417 more students which equated to an increase of 0.2%. However, there was variation by degree level.
1
This was done through an enhancement of IBHE’s fall enrollment I survey. This information has been traditionally referred to as IBHE preliminary fall enrollments. Fall enrollment is considered final once student-level records are collected and processed for inclusion is IBHE public-facing data tools. IBHE leveraged its component of the Illinois Longitudinal Data System to create parallel baseline information for AY2019-20 to examine the main pipelines of new students year over year, and when possible disaggregated the information by race/ethnicity and gender. The enrollment information from AY2019-20 is considered final, but it should be noted that at times the information can be updated when definitional alignment issues are identified.
Figure 1: Illinois Public University Headcount
Enrollments
from Fall of Academic Year 2019-20 to 2020-21
As shown in Table 1, overall fall enrollment in 2019-20 at Illinois public universities (including both undergraduate and graduate programs) slightly increased (+463 FTE) from academic year 2018-19 and is down -4.8% (-8,321 FTE) from academic year 2015-16. Western Illinois University (-11.7%), Southern Illinois University Carbondale (-8.9%), and Northeastern Illinois University (-6.9%) experienced the largest overall enrollment declines relative to 2018-19. The University of Illinois at Chicago (+5.7%), Eastern Illinois University (+2.6%), the University of Illinois at Urbana-Champaign (+2.5%), Chicago State University (+2.3%), and Illinois State University (+1.6%) experienced overall increases relative to 2018-19.
Table 1: Combined Undergraduate and Graduate Enrollment (based on FTE)
Undergraduate Enrollment (FTE) Overall undergraduate enrollment was down by -1.0% (-1,345 students), with new first-time full-time undergraduates (generally freshmen) declining by -5.4% and new full-time transfers declining by -7.3%. The overall decline at Illinois public universities was slightly better than what was being reported nationally for public universities (-1.9%) at the undergraduate level.2 The number of continuing undergraduates was also slightly down year over year (-0.5%).
The relatively large overall declines in two of the main pipelines of new undergraduates at Illinois public universities along with the small net decline demonstrated how the large expansion of dual credit enrollment helped to moderate the overall loss of undergraduate students, despite being a fairly small proportion of overall undergraduate enrollment (1.9% in 2020-21). Dual credit is when academically qualified high school students enroll in courses through formal arrangements between colleges and high schools and receive both high school and college credit. Dual enrollment is typically less formal and involves a high school student taking a college class without necessarily receiving high school credit. Relative to 2019-20, there were 644 additional dual credit students enrolled, an increase of 35.4%.
Table 1: Undergraduate Enrollment Type for Illinois Public Universities (Headcount)
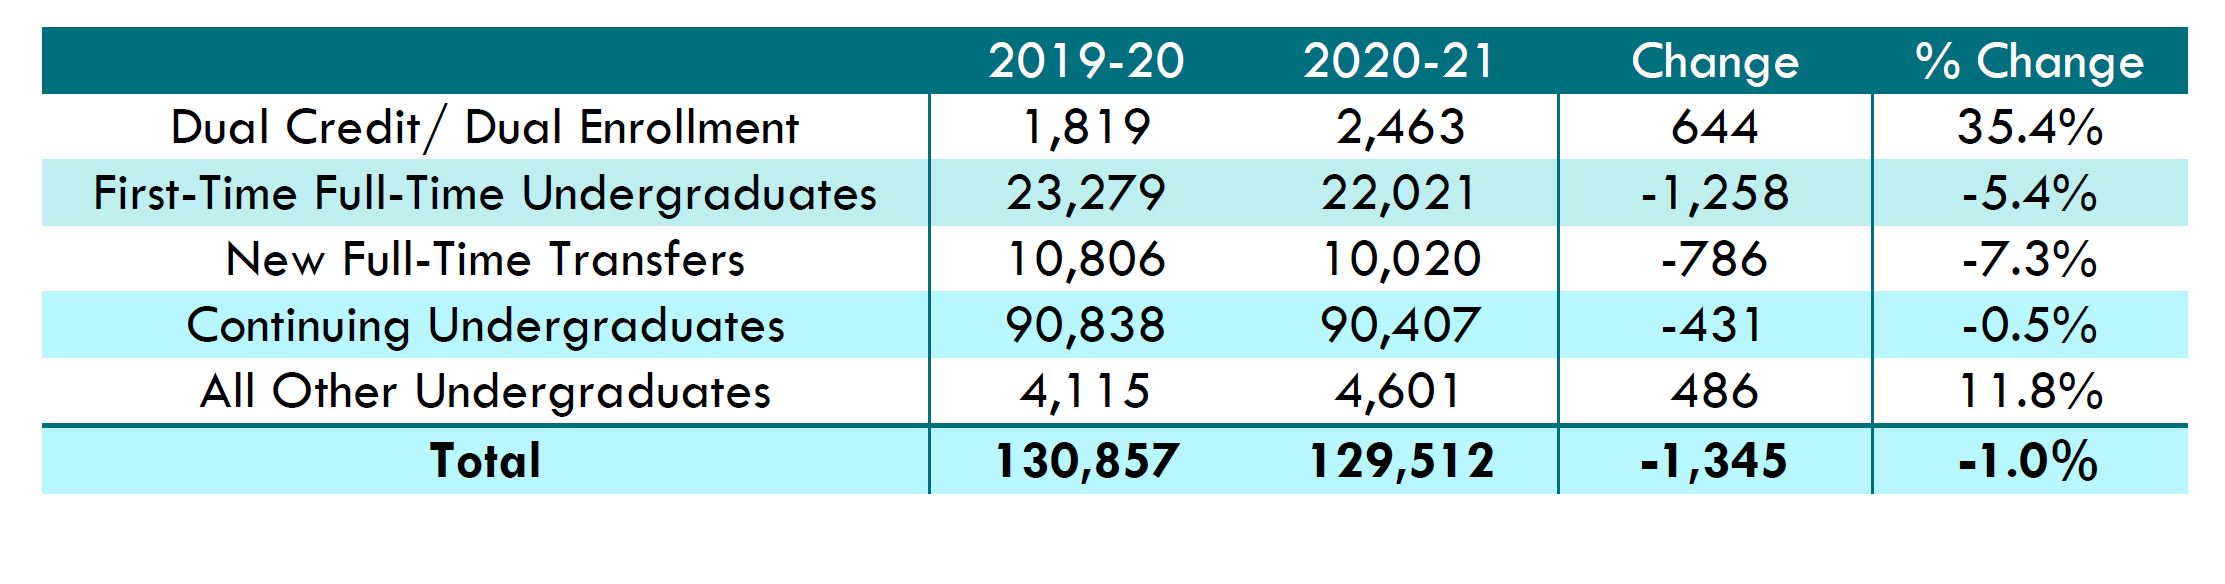
In the future, this report will also include more detailed information on part-time undergraduates to better reflect the varying missions of the Illinois public universities. Such students, along with the non-degree seeking undergraduates that fall outside of the dual-credit distinction were included in the ‘All Other Undergraduates’ category.
Graduate and professional enrollmentat Illinois public universities increased by nearly 1,800 students or 3.4% year over year. This is on par with the 3.6% growth in graduate enrollment that is being reported nationally for public universities. As undergraduate enrollments comprise a much larger share of overall enrollments at Illinois public universities (slightly more than 70%), total enrollments were up by 417 or 0.2% relative to fall of AY2019-20.
Institutional Highlights and Detailed Enrollment
Dual Credit/Dual Enrollment. As shown in Table 2, dual credit enrollments were up by over one-third, and they were primarily driven by robust year over year growth at Eastern Illinois University (EIU). EIU experienced an annual increase of 648 dual credit students which equated to an annual 41% change. In fact, EIU accounts for over 90% of the dual credit enrollments among the Illinois public universities (2,228 of the 2,463 reported headcount enrollments). WIU experienced modest growth in dual credit enrollment (57 to 86) and NEIU and UIS went from reporting no dual credit enrollment in 2019-20 to having limited enrollments in 2020-21(29 and 11 respectively). CSU reported 58 dual credit enrollments in fall of AY2019-20, but none in the fall of AY2020-21.
Table 2: Dual Credit/Dual Enrollment at Illinois Public Universities (Headcount)

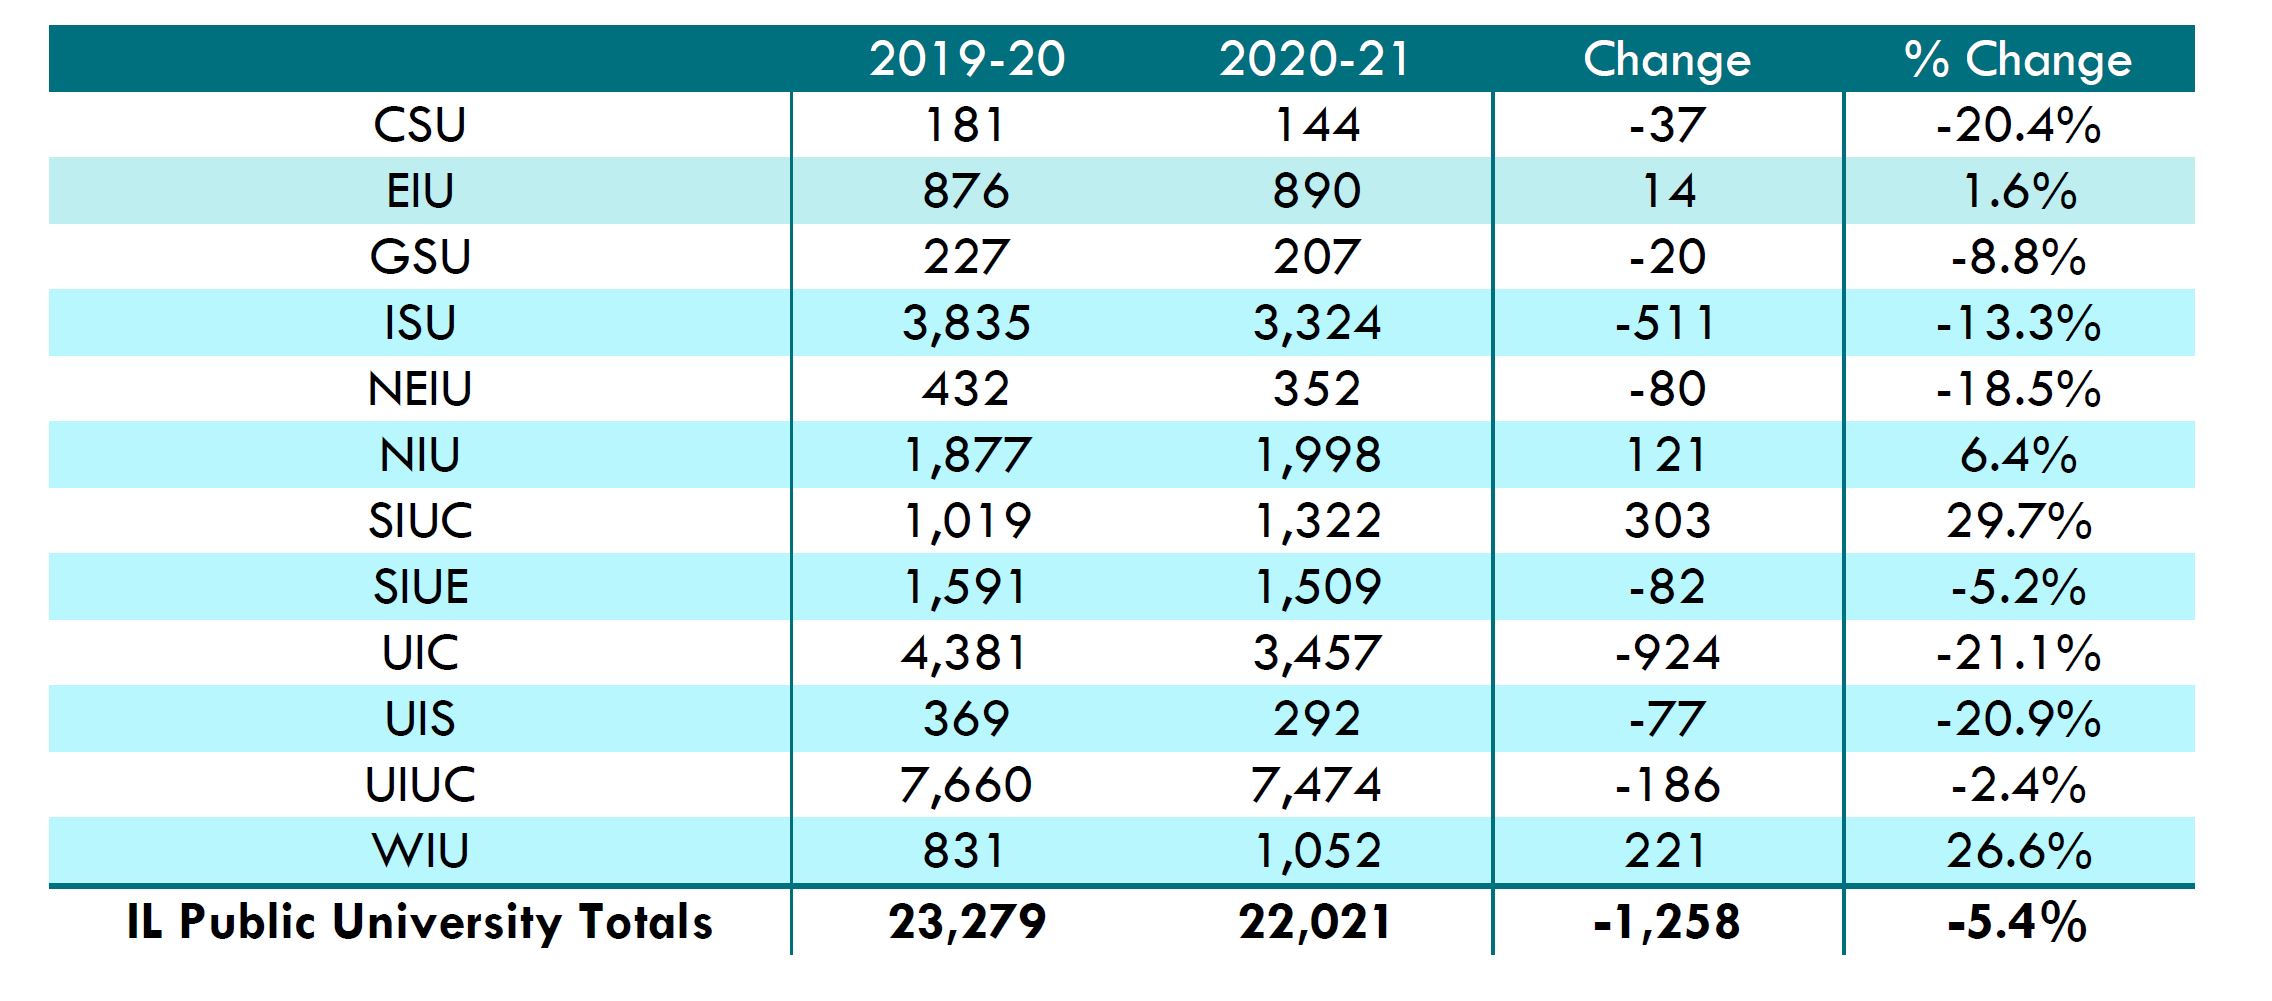
First-Time Full-Time Undergraduates. As shown in Table 3, SIUC (303 additional students and 29.7%), and WIU (221 additional students and 26.6%) experienced growth in new first-time undergraduate students, as did NIU (6.4% and 121 additional students).
Table 3: First-Time Full-Time Undergraduates (Freshmen) at Illinois Public Universities (Headcount)
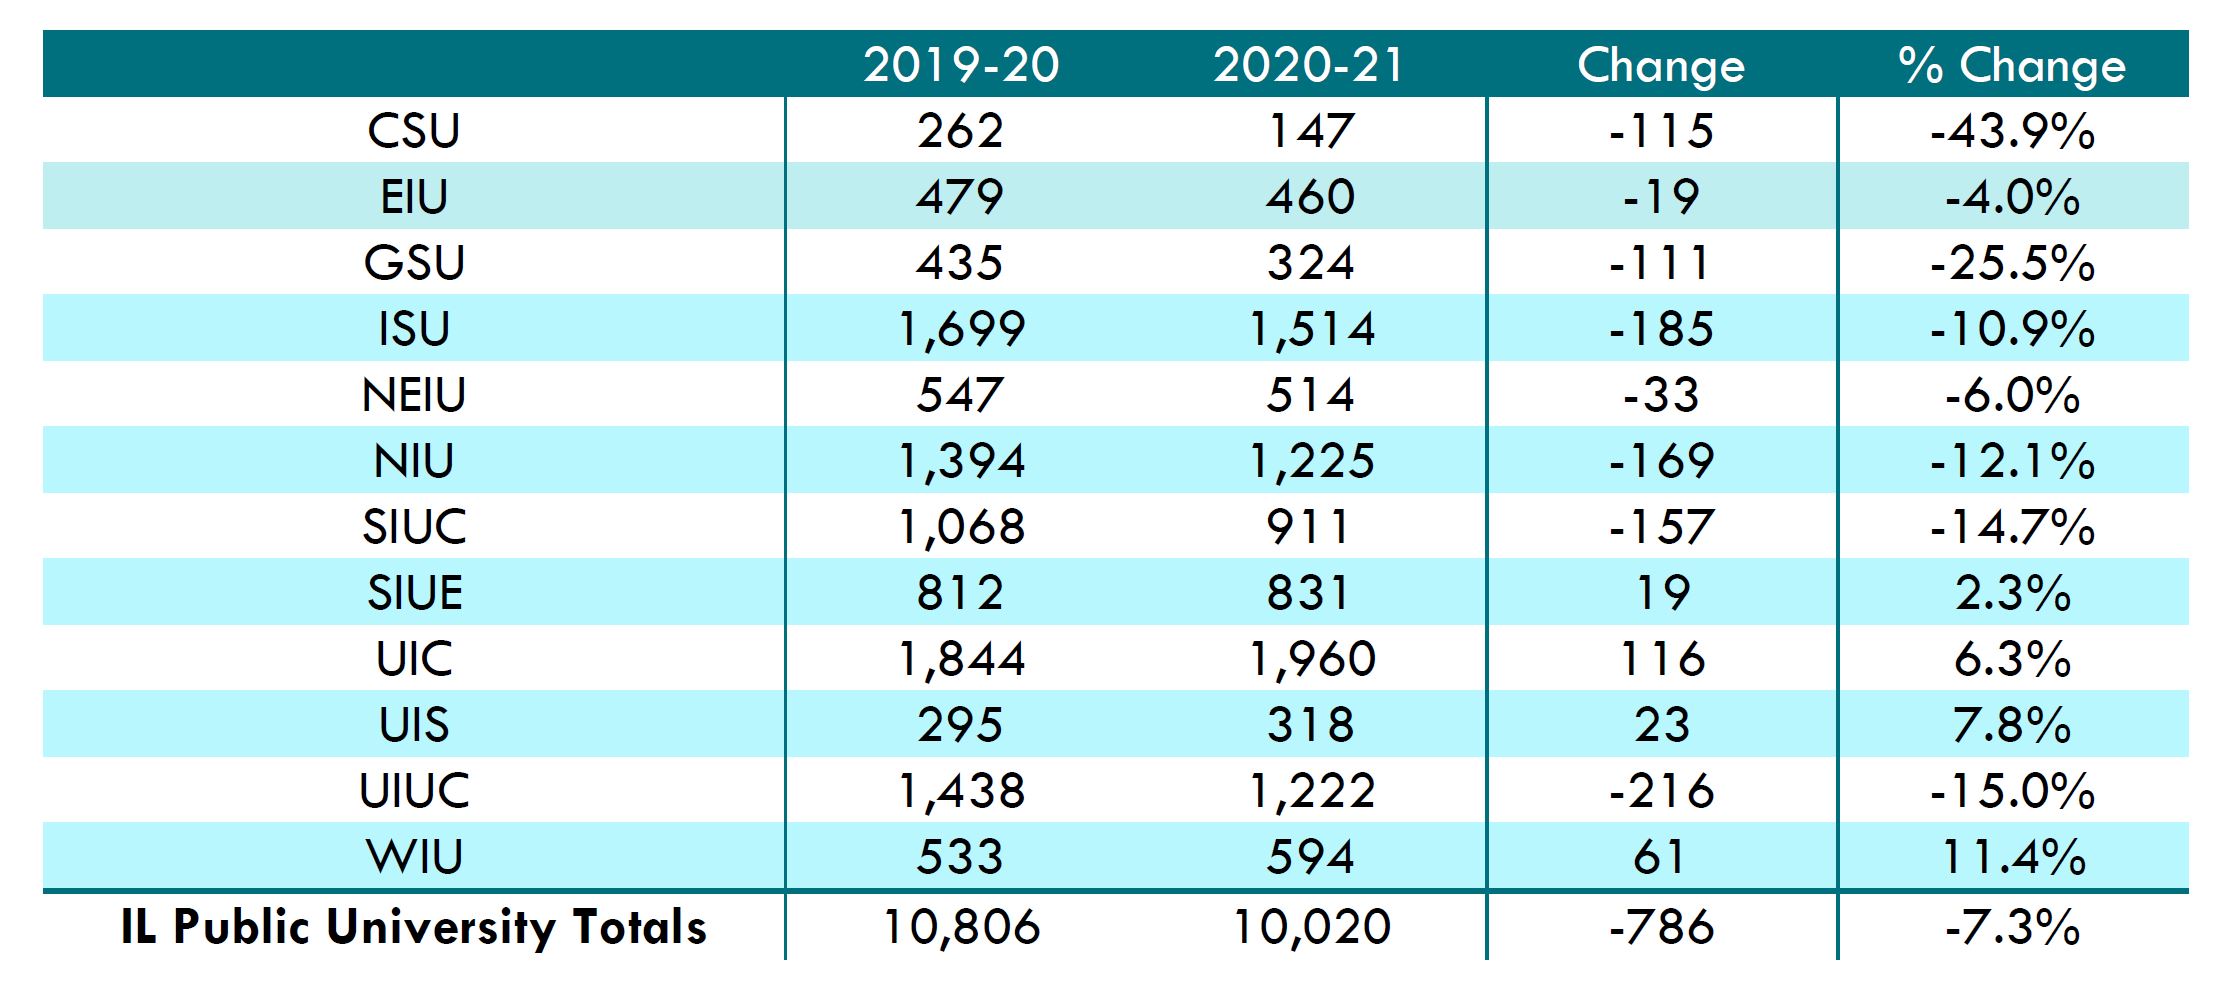
New Full-Time Transfer Students. Despite overall new full-time transfer enrollments being down 7.3%, WIU, UIS, UIC, and SIUE experienced year-over-year growth. CSU, GSU, UIUC, SIUC, and NIU experienced relatively large year-over-year declines of new transfers.
Table 4: New Full-Time Transfer Students at Illinois Public Universities (Headcount)
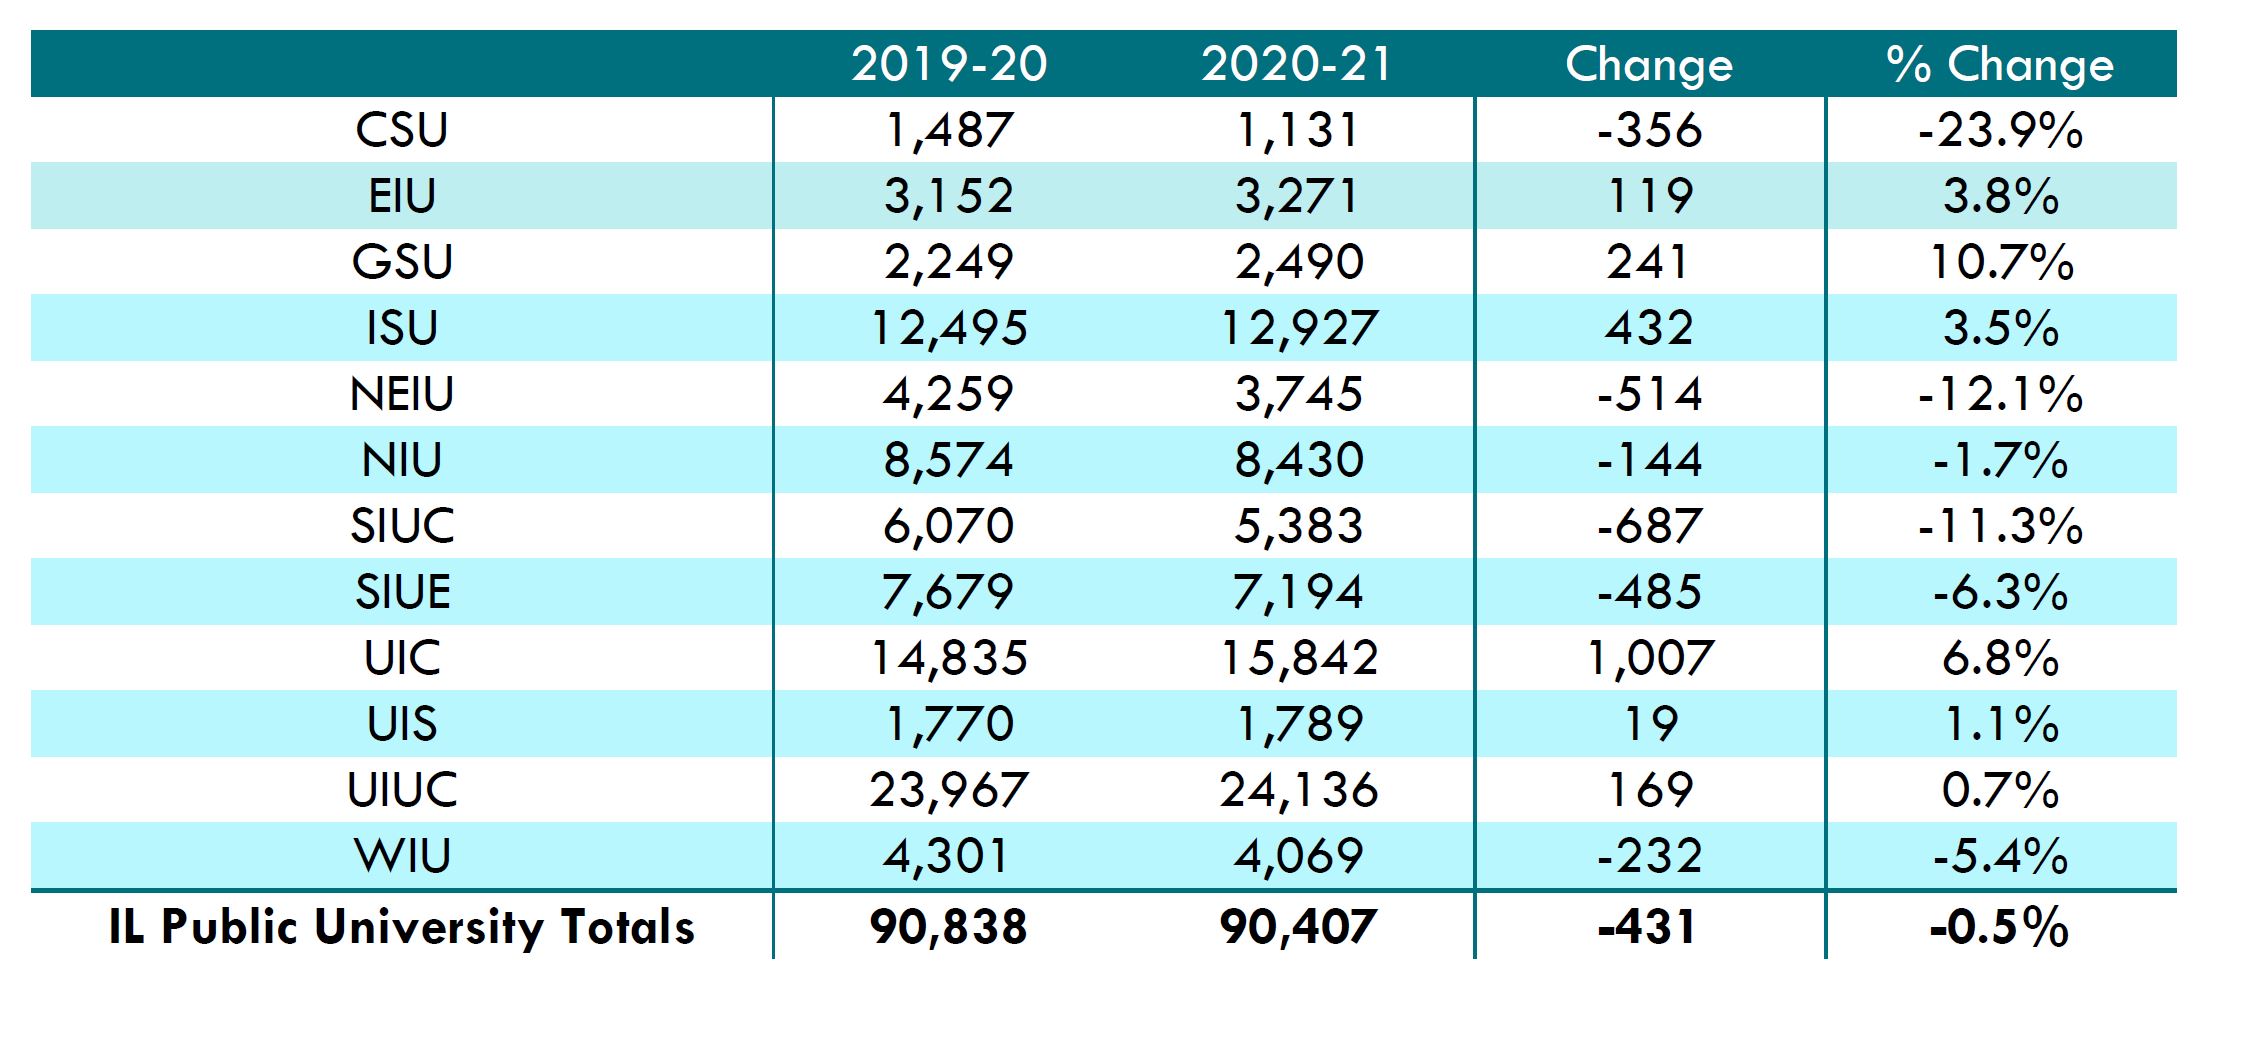
Continuing Undergraduate Students. Overall, there were 431 fewer continuing undergraduate students comparing 2019-20 to 2020-21, which equated to a decline of 0.5%. GSU (10.7%), UIC (6.8%), EIU (3.8%), and ISU (3.5%) experienced the largest year-over-year increases in continuing undergraduate students. CSU (-23.9%), NEIU (-12.1%), and SIUC (-11.3%) experienced the largest declines in continuing students.
Table 5: Continuing Undergraduate Students at Illinois Public Universities (Headcount)
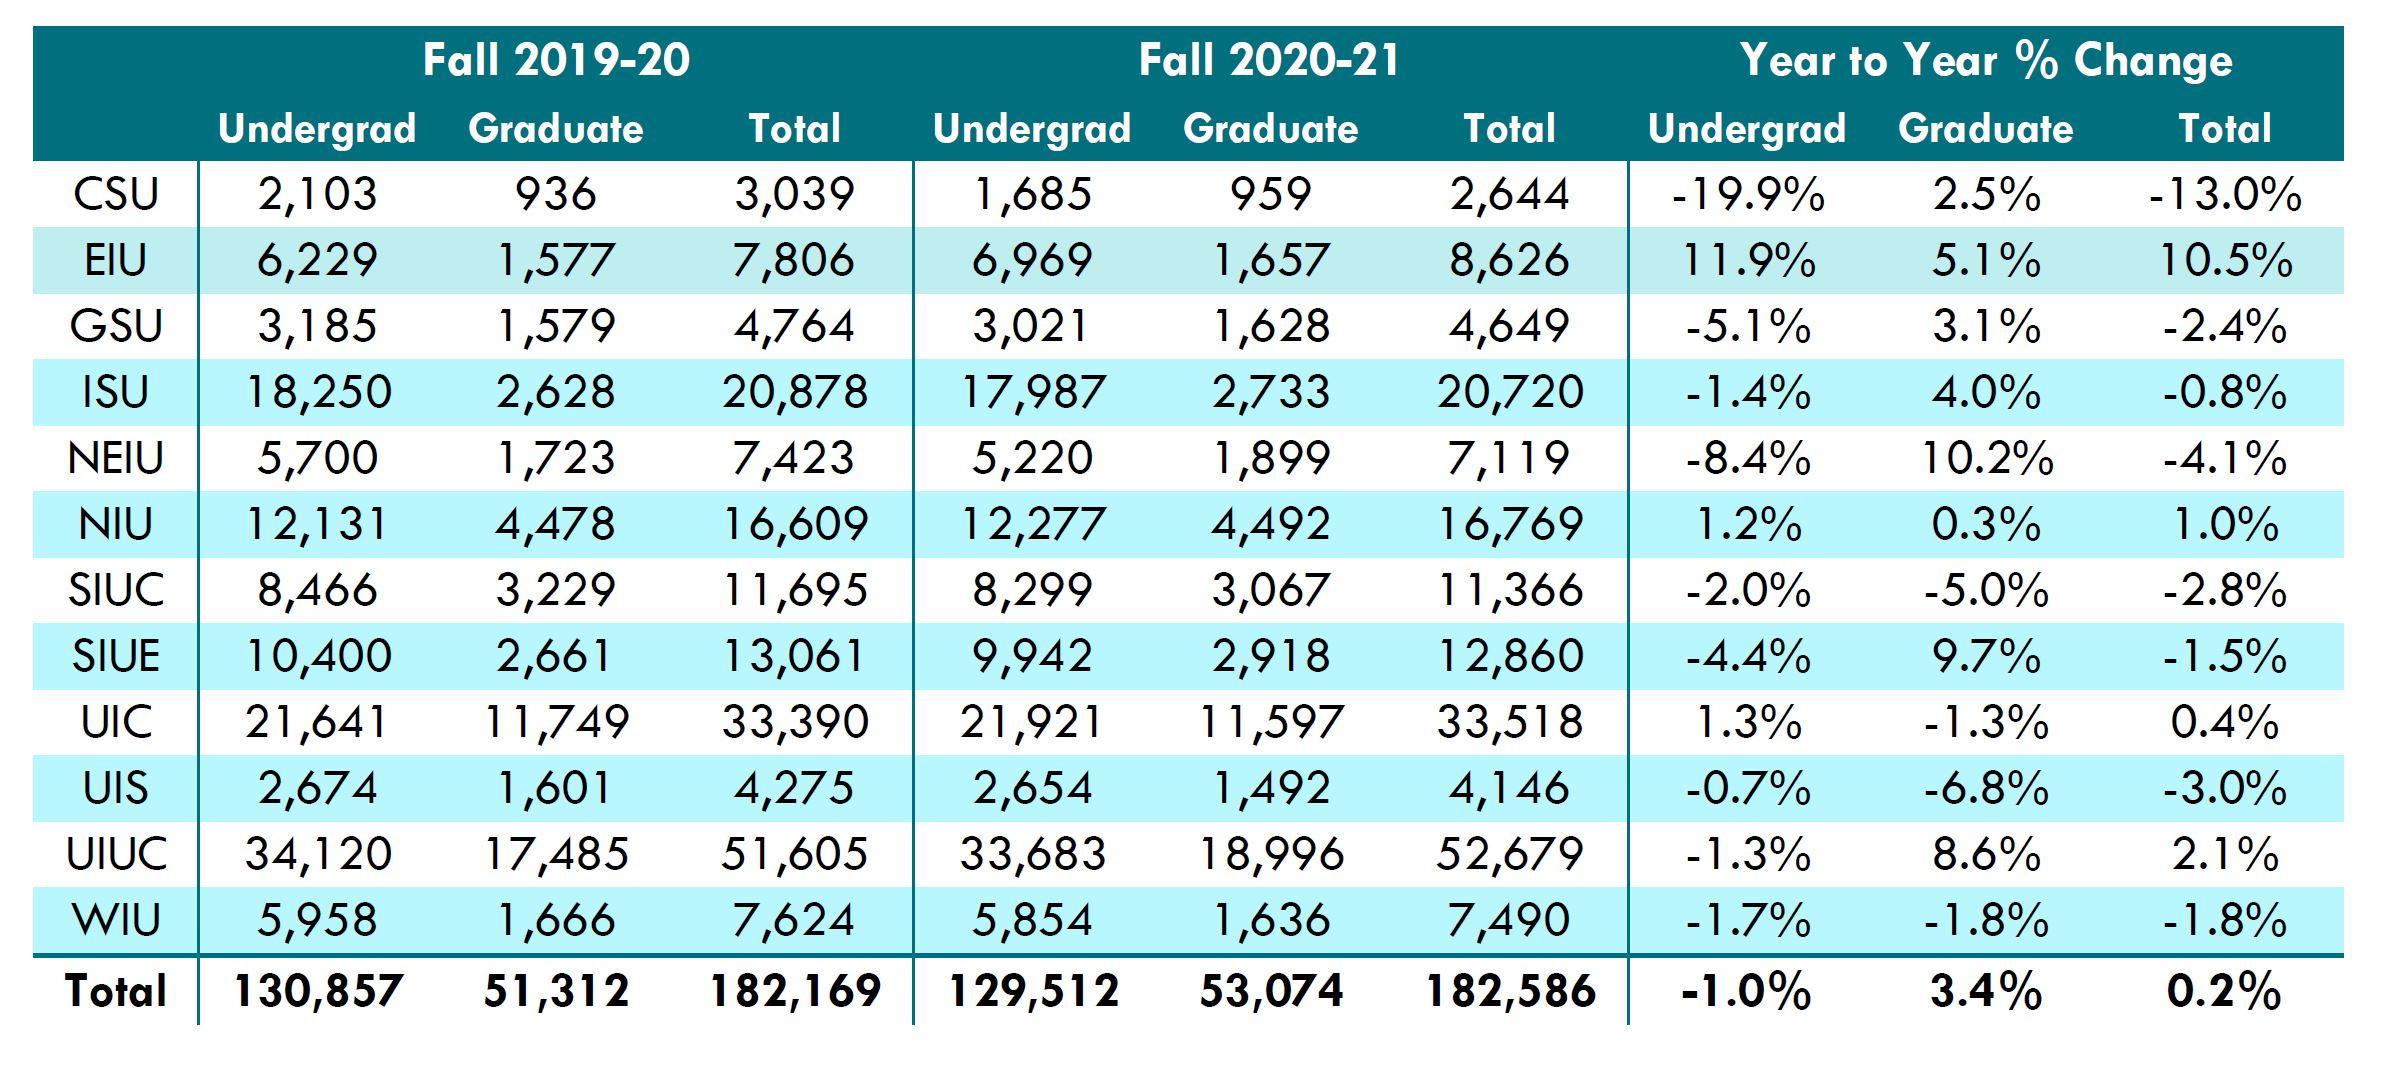
Graduate and Undergraduate Enrollment Summary. When examining all undergraduate enrollments, only three of the Illinois public universities experienced year-over-year growth: EIU (11.9%); UIC (1.3%); and NIU (1.2%). CSU (-19.9%) and NEIU (-8.4%) experienced the largest overall undergraduate enrollment declines.
Eight of the Illinois public universities experienced growth in graduate/professional enrollments compared to fall of AY 2019-20. NEIU had the largest percent increase (10.2% and 176 additional students), followed by SIUE (9.7% and 257 additional students), UIUC (8.6% and 1,511 additional students), and EIU (5.1% and 80 additional students).
Table 6: Enrollments and Year to Year Change (Headcount)
Overall Enrollment Patterns by Race/Ethnicity
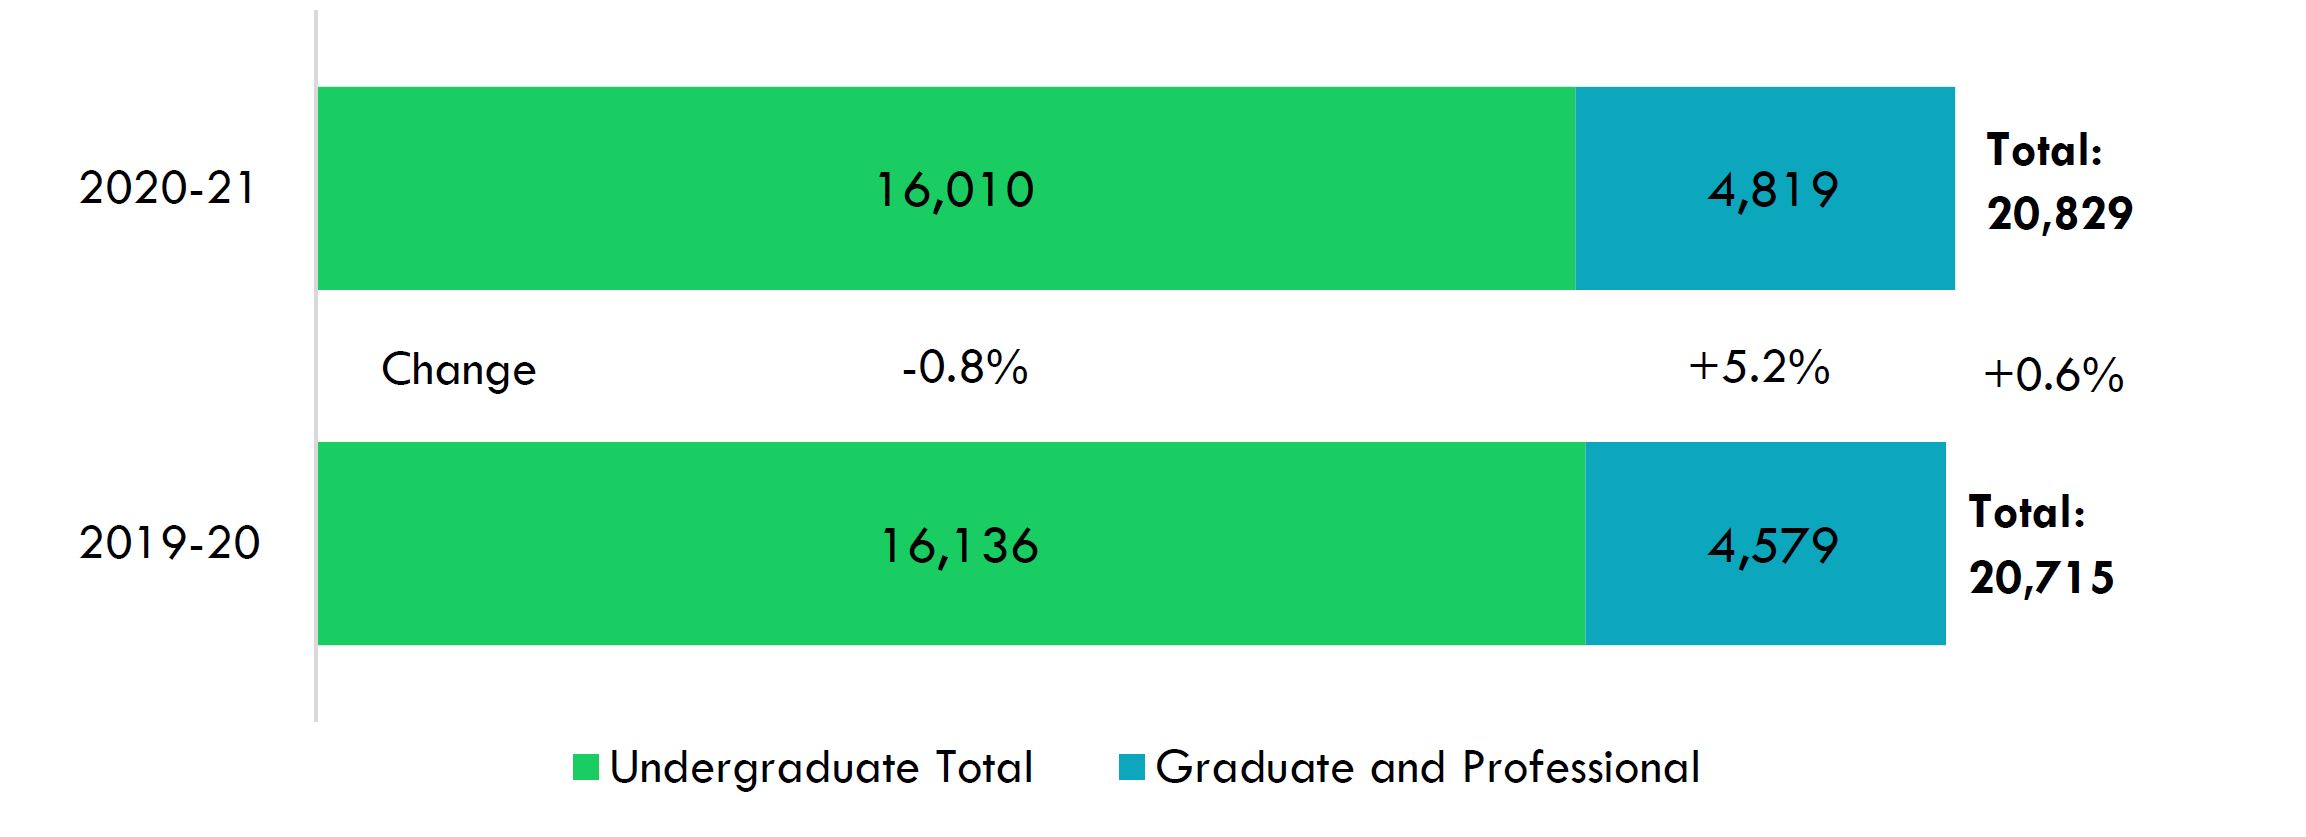
African American Enrollments. Overall African American enrollment at Illinois public universities was up 0.6% to nearly 21,000. As shown in Figure 2, undergraduate enrollments were down by -0.8% to 16,010 and graduate and professional enrollments grew by 5.2% to 4,819.
Figure 2: Headcount Enrollment of African American Students at Illinois Public Universities
White Enrollments. Overall, there were roughly 600 fewer white students enrolled at Illinois public universities, an enrollment loss of -0.7%. Undergraduate enrollment of white students was down 1,884 or -2.9%; however, there was an increase in the number of white students enrolled in graduate/professional school (5.3% or 1,287 additional students).
Figure 2: Headcount Enrollment of African American Students at Illinois Public Universities
Non-Resident Alien Enrollments. Illinois public universities experienced relatively large enrollment declines among non-resident aliens across all the enrollment areas that were examined. As shown in Figure 5, the overall enrollment decline for such students was -11.1%, with similar proportional losses of graduate/professional enrollments (-11.6%) and in total undergraduate enrollments (-10.4%).
Figure 5: Headcount Enrollment of Non-Resident Aliens at Illinois Public Universities

Race/Ethnicity and Gender Analysis
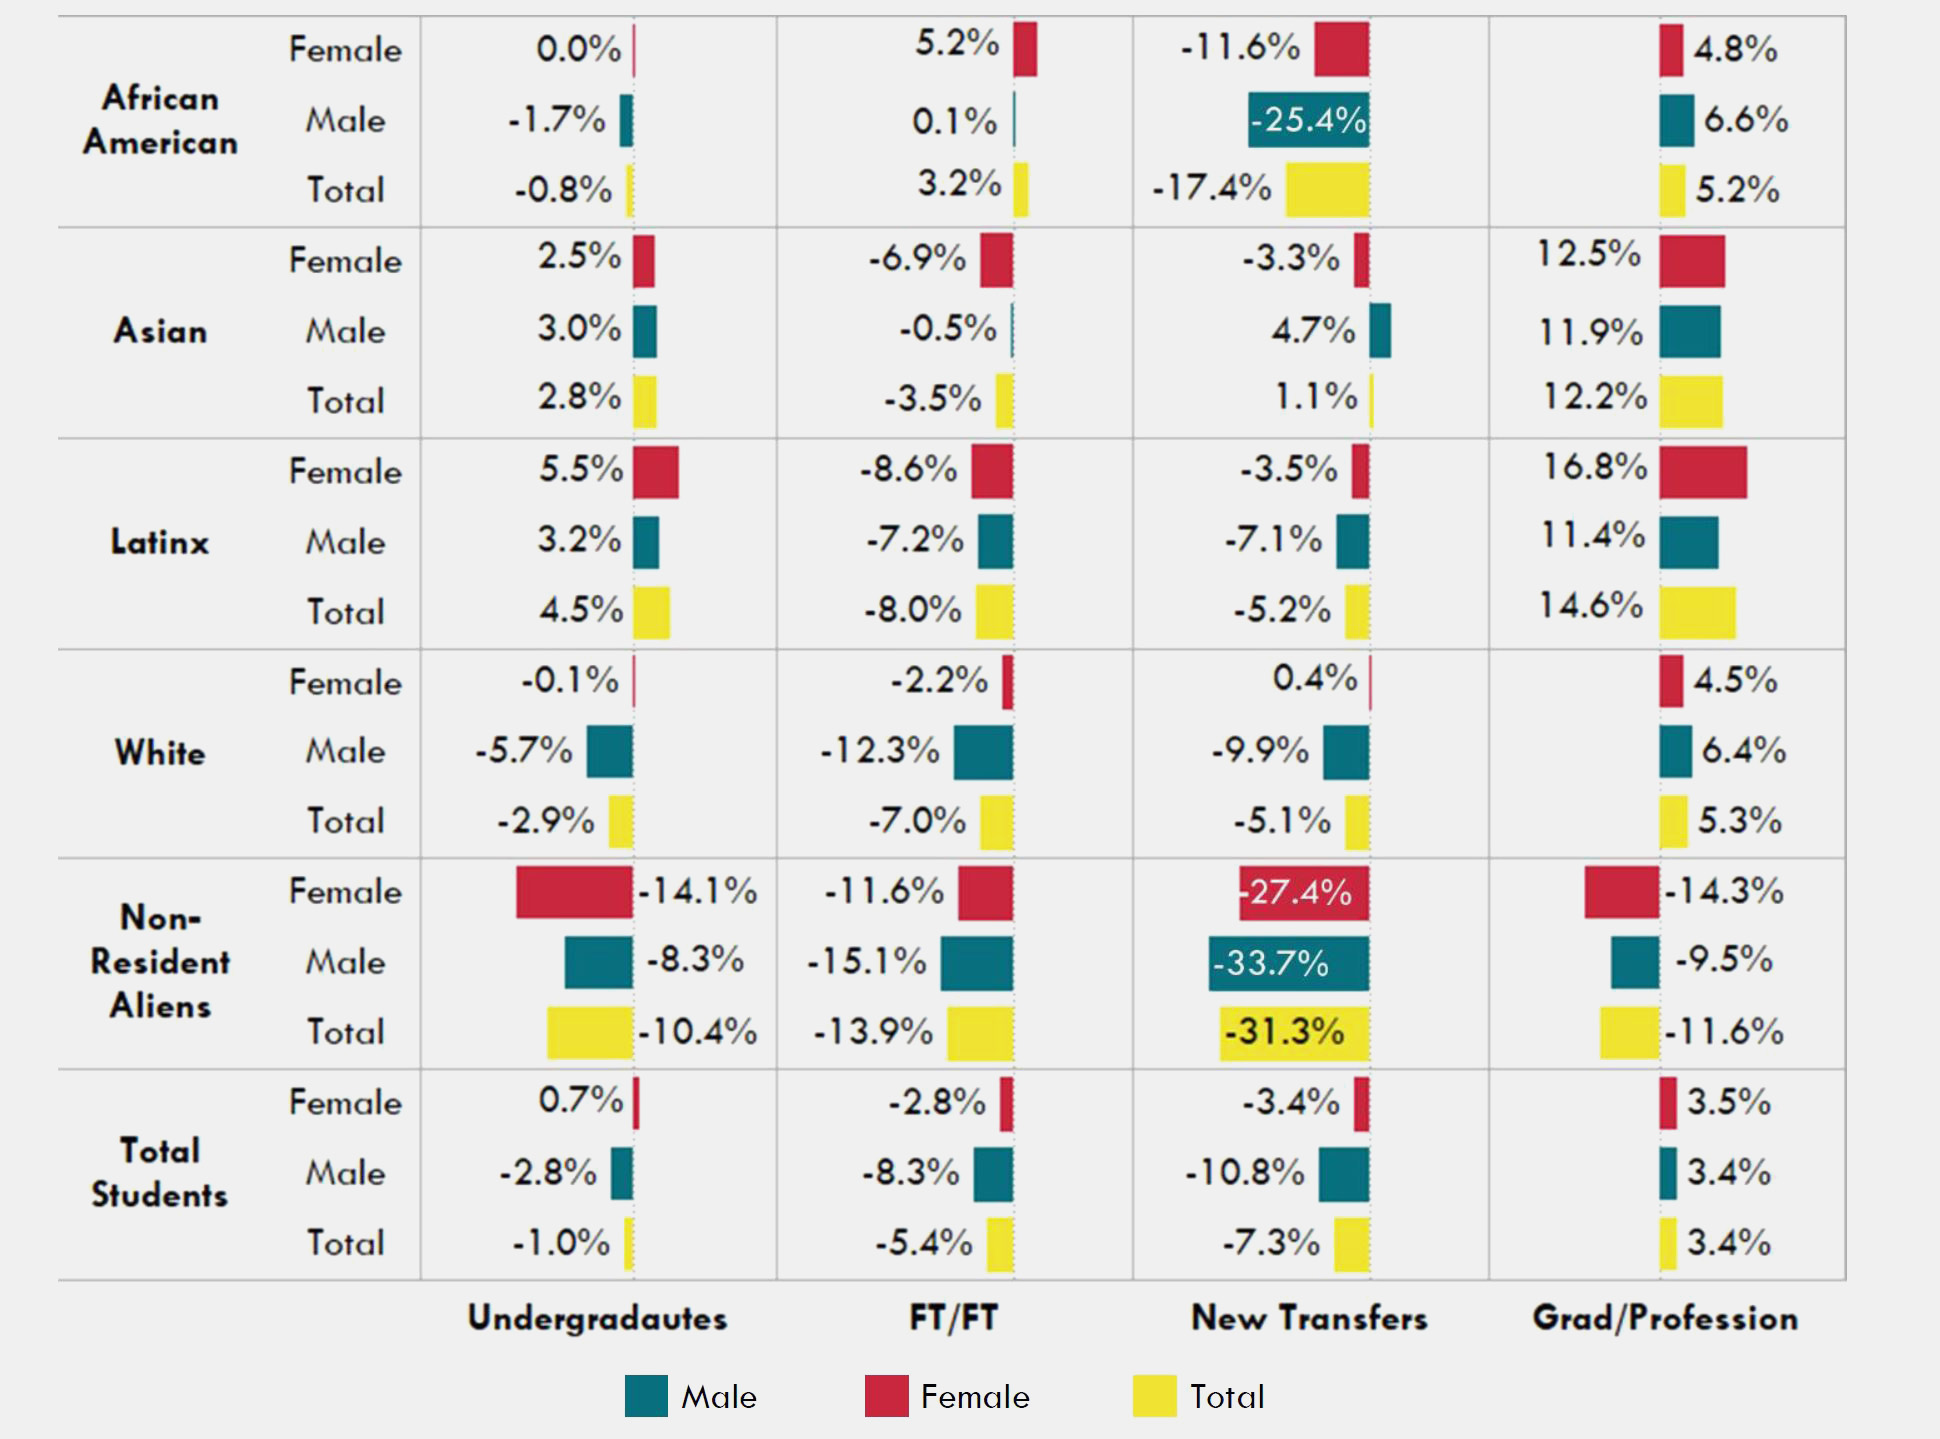
African American Enrollments. Undergraduate enrollment of African American females was flat, while there was a small decline in the undergraduate enrollment of African American males (-1.7%). Illinois public universities experienced growth among African American freshmen females (5.2% increase) while there was limited growth among African American males (0.1% increase). The decline in new transfers to public universities was much greater for African American males (-25.4%) relative to African American females (-11.6%).
There were graduate and professional enrollment gains among African American males (6.6%) and African American females (4.8%) at Illinois Public Universities.
Latinx Enrollments. Overall undergraduate enrollment increased for Latinx students, despite declines among new freshmen and new transfer students. The change from 2019-20 for first-time full-time undergraduate enrollment was fairly similar among Latinx males (-7.2%) and females (-8.6%). However, Latinx males experienced a decline in new transfer enrollments that was more than two times greater than their female peers (-7.1% to -3.5%).
At the graduate/professional level, public universities enrolled higher numbers of Latinx males (11.4%) and females (16.8%) when compared to fall of academic year 2019-20.
White Enrollments. Year-over-year enrollment patterns of white undergraduates differed for males and females. Undergraduate enrollment among white females was relatively flat from year to year, while there were comparatively larger declines of white males overall (-5.7%), among first-time full-time undergraduates (-12.3%), and with new full-time transfers (-9.9%).
When compared to fall of academic year 2019-20, Illinois public universities enrolled proportionally higher numbers of white males (6.4%) and white females (4.5%) at the graduate/professional level.
Non-Resident Alien Enrollments. The largest enrollment declines in fall of academic year 2020-21 were generally among non-resident aliens. For graduate/professional enrollments, the declines among non-resident alien females (-14.3%) were larger than their male peers (-9.5%). For undergraduate enrollment, Illinois public universities enrolled -8.3% fewer non-resident alien males and -14.1% fewer females.
Figure 6: Change in Headcount Enrollments at Illinois Public Universities by Enrollment Type: Change from 2019-20 to 2020-21
Fall Full-Time Equivalent (FTE) Enrollment
FTE enrollment is defined as 15 undergraduate hours or the equivalent of one full-time student at that level, and 12 credit hours at the graduate level. As shown in Table 7, FTE enrollment largely paralleled the patterns evident with headcount enrollments. However, the growth in graduate/professional enrollments was somewhat smaller when viewed as a function of credit hours (only 1.6% growth, as opposed to 3.4% with headcount), resulting in an overall FTE enrollment decline of -0.3%.
Table 7: Illinois Public University Full-Time Equivalent (FTE) Enrollments and Year to Year Change

Technical Note:
For some of the public universities, the application of the operational definitions used in IHEIS for the fall 2019-20 information and the ways in which the first-look/preliminary data were collected and reported for 2020-21 do not perfectly align. Therefore, in certain instances, some of the sub-totals may be marginally different from how they are reported locally (e.g., new full-time transfer students). IBHE will continue to work with the public universities to resolve some of these minor definitional alignment issues as the data move from being first-look/preliminary to final.